For the fourth year in a row, The Dartmouth conducted a survey recording the opinions and experiences of Dartmouth’s graduating class. Since arriving at Dartmouth in 2015, the Class of 2019 has experienced the aftershocks of changes at the College, in the nation, and across the globe — all while traversing their academic work and arranging their post-graduation lives. The following four sections canvas the Class of 2019’s views on campus issues, student life, national politics and their futures ahead.
Campus Issues
Following the tradition of the classes preceding them, the Class of 2019 holds generally negative views of the College’s administration. Some 57 percent of the class has a generally unfavorable view of the administration, compared to only eight percent that favors the administration. However, compared to previous years, seniors seem to feel less strongly on this topic — 35 percent of the Class of 2019 are not sure about their opinion on the administration, compared to 10 percent of the Class of 2017. The Class of 2019 also views College President Phil Hanlon negatively; 43 percent view him unfavorably, compared to the 17 percent who view him favorably. Interestingly enough, the negativity directed toward Hanlon continues to weaken, year after year: this 42 percent represents a decline from the 44 percent of the Class of 2018 and the 60 percent of the Class of 2017 who viewed Hanlon unfavorably.
Specific policies from the administration carry the senior class’s negative outlook. Moving Dartmouth Forward continues to be highly disliked, with a favorable-unfavorable split of 13-50. The introduction of housing communities is also viewed generally unfavorably, at 26-44. On the other side of the table, the Greek system is generally viewed favorably, at 46-28. Unsurprisingly, those who view the Greek system as favorable were highly against Moving Dartmouth Forward, with a 4-65 split on the latter. But even those who see the Greek system as flawed view Moving Dartmouth Forward unfavorably regardless, with a 20-46 split.
Regarding the attention and resources devoted to sexual violence prevention on campus, the Class of 2019 proves significantly more satisfied than previous classes: just over two-thirds of the class are either extremely satisfied or somewhat satisfied, while only one-third of the class is very dissatisfied or somewhat dissatisfied. This constitutes a consistent improvement over previous years: in 2017, seniors were generally dissatisfied (35-45 split), while in 2018, seniors were only very slightly satisfied (44-39 split). Despite improvements over time, female students are generally more dissatisfied than male students on this topic.
Resources toward mental health are perceived as more inadequate, however. Overall, 41 percent of the Class of 2019 are either extremely satisfied or somewhat satisfied with the amount of resources dedicated toward mental health, while 59 percent are either very unsatisfied or somewhat unsatisfied. Just five percent of seniors are extremely satisfied.
Regarding other important Dartmouth institutions, the Class of 2019 views Dartmouth Dining Services slightly unfavorably, with a favorable-unfavorable split of 29-42. This result represents a slight decline from years past; the Class of 2017 reported a dead-even 41-41. 2019 seniors view Campus Safety & Security somewhat positively: 38 percent hold favorable views, compared to 26 percent with unfavorable views. Perhaps unsurprisingly, members of fraternities tend to have more negative views (48 percent unfavorable) than members of sororities, co-ed fraternities, and the unaffiliated (16 percent unfavorable). The Dartmouth faculty has been near-universally appreciated by past classes, and the Class of 2019 is no exception: 85 percent view the college faculty favorably, compared to only one percent who view the faculty unfavorably.

by William Chen and Aaron Lee / The Dartmouth
Student life
Academics continue to be a focal point for Dartmouth seniors. Ninety-four percent report that they are either very or somewhat satisfied with their Dartmouth education, nearly identical with the Class of 2018 and 2016 (95 percent), and higher than the Class of 2017 (88 percent). When asked about factors that shaped their choice of major, 87 percent responded that academic interest is a very important factor, and the remaining 13 percent responded that it is a somewhat important factor; not a single respondent found academic interest to be unimportant for their major choice. The second most important factor is post-graduation career, with 88 percent describing it as either very or somewhat important. Family pressure and easiness are both somewhat considered; 42 percent and 33 percent of seniors, respectively, found that these factors have some amount of influence over their major choice, though very few (nine percent and three percent, respectively) said that these factors are very important.
When asked about the importance of various aspects of the student experience, this focus on academics persists. 76 percent of seniors describe academics as very important, and an additional 19 percent as somewhat important — far more than any other category asked. Social life is a close second, with 92 percent responding that it is very or somewhat important; this is followed by extracurricular activities at 82 percent, Dartmouth traditions at 60 percent, Greek life at 59 percent and Study Abroad at 58 percent. Slightly less important are paid employment at 55 percent, outdoor activities at 51 percent, and varsity sports at 30 percent; less important still are housing communities, with a meager four percent.

by William Chen and Aaron Lee / The Dartmouth
One such Dartmouth tradition that routinely receives a lot of attention is the Dartmouth Seven, a set of seven locations on campus where students are challenged to have sex. Regardless, 66 percent of 2019 seniors say they did not complete any of the Dartmouth Seven, similar to rates in previous years (60 percent in 2018, 66 percent in 2017). The most popular of the Dartmouth Seven remain the Stacks, at 27 percent, and BEMA, at 22 percent. However, the three least-completed members of the past — the Steps of Dartmouth Hall, the Top of the Hop, and the center of the Green, each with single-digit completion rates — have had a resurgence of sorts, with 11 percent, 12 percent, and 10 percent completion rates, respectively. Additionally, 11 percent of seniors completed the President's Lawn, while the 50-yard line became the least popular of the Seven at only six percent. Like in past years, the Greek affiliated tended to complete the Dartmouth Seven more than the unaffiliated; however, the difference was much smaller, at 41 percent for the affiliated and 17 percent for the unaffiliated, compared to 53-15 in 2018. Members of fraternities also had a particular affinity for the President's Lawn and the Steps of Dartmouth Hall, completing these at around twice the rates of the unaffiliated or members of sororities (14 percent to eight percent for both).
Other aspects of student relationships prove to have changed from years past, as well. A plurality, 33 percent, now report that they did not date anyone at Dartmouth. Thirty-one percent report dating one person (previously the plurality at 42 percent); 25 percent report dating two people; and 11 percent report dating three or more people. Similar to previous years, 42 percent of students report having had sex for the first time at Dartmouth, and a further 43 percent report having had sex before Dartmouth; the remaining 15 percent report never having sex at all.
Regarding the use of drugs and alcoholic substances, 27 percent of students report drinking for the first time at Dartmouth; and 37 percent report using other drugs/substances for the first time at Dartmouth. Seventy percent of students report drinking before Dartmouth — the remaining three percent report having never drunk at all. Thirty-four percent of seniors report having never done any other drugs/substances. Among those who did use drugs/substances while at Dartmouth, the drug of choice tended to be marijuana, with 93 percent reporting having used it at some point during their time at college. Other drugs had much lower use rates: 47 percent report having used tobacco, 33 percent report having used non-prescribed medications, 28 percent report having used cocaine and 11 percent report having used LSD.
When asked which of five key Dartmouth events — First-Year Trips, Homecoming, Winter Carnival, Green Key and Sophomore Summer — were the most important for students, Green Key surged past Sophomore Summer and First-Year Trips to become the most important event for the Class of 2019, with 70 percent describing it as either very important or important. Sophomore Summer was next, at 69 percent; First-Year Trips at 67 percent; Homecoming at 63 percent; and last was Winter Carnival, at just 33 percent.
National Politics
The Class of 2019 will have graduated during a time when national politics are becoming increasingly polarized, with socialism gaining popularity on the left and more clearly nationalist ideas taking ahold of the right. During their time at Dartmouth, they experienced one of the fiercest presidential elections ever; many popular movements such as the #MeToo movement; and recent issues such as the Russia probe and the ongoing trade war with China. It is interesting, then, what the seniors make of all this.

by William Chen and Aaron Lee / The Dartmouth
Overall, most seniors describe themselves as somewhat liberal, at 34 percent; 26 percent describe themselves as very liberal, while 20 percent describe themselves as moderate, 13 percent as somewhat conservative and seven percent as very conservative. Given the increasing political polarization happening on the national level, however, it is perhaps surprising that the Class of 2019’s overall political/ideological views have changed very little since they began at Dartmouth four years ago — the percentages of those describing themselves as very liberal, somewhat liberal, moderate, somewhat conservative and very conservative differ by zero to three percent in each category. This is also a significant breakaway from previous classes, for whom Dartmouth seems to have made a much larger impact on political views: for instance, the Class of 2018 saw a 14 percent increase in the very liberal category, while the Class of 2017 saw a 17 percent increase; the Class of 2019, on the other hand, saw a two percent decrease.
Given the strongly liberal class body, it is unsurprising that many right-wing institutions are generally viewed negatively. Eighty-seven percent of the Class of 2019 have an unfavorable view of President Donald Trump, 78 percent have an unfavorable view of the Republican Party, and 63 percent have an unfavorable view of the trade war with China. Interestingly, despite being strongly liberal, the Class of 2019 has mixed views on the Democratic Party: 34 percent view the Democratic Party favorably, 32 percent view the Democratic Party unfavorably and 34 percent are unsure. Students are also divided on the Supreme Court, which has a favorable-unfavorable split of 25-24, and on the Russia investigation, at 24-31. Wall Street and Congress are viewed more unfavorably, with a 16-39 favorable-unfavorable split for the former and an 8-48 split for the latter. Wall Street, in particular, has been seen increasingly unfavorably over the past few years: 26 percent of the Class of 2018 viewed Wall Street favorably, and 53 percent of the Class of 2017 viewed Wall Street favorably.
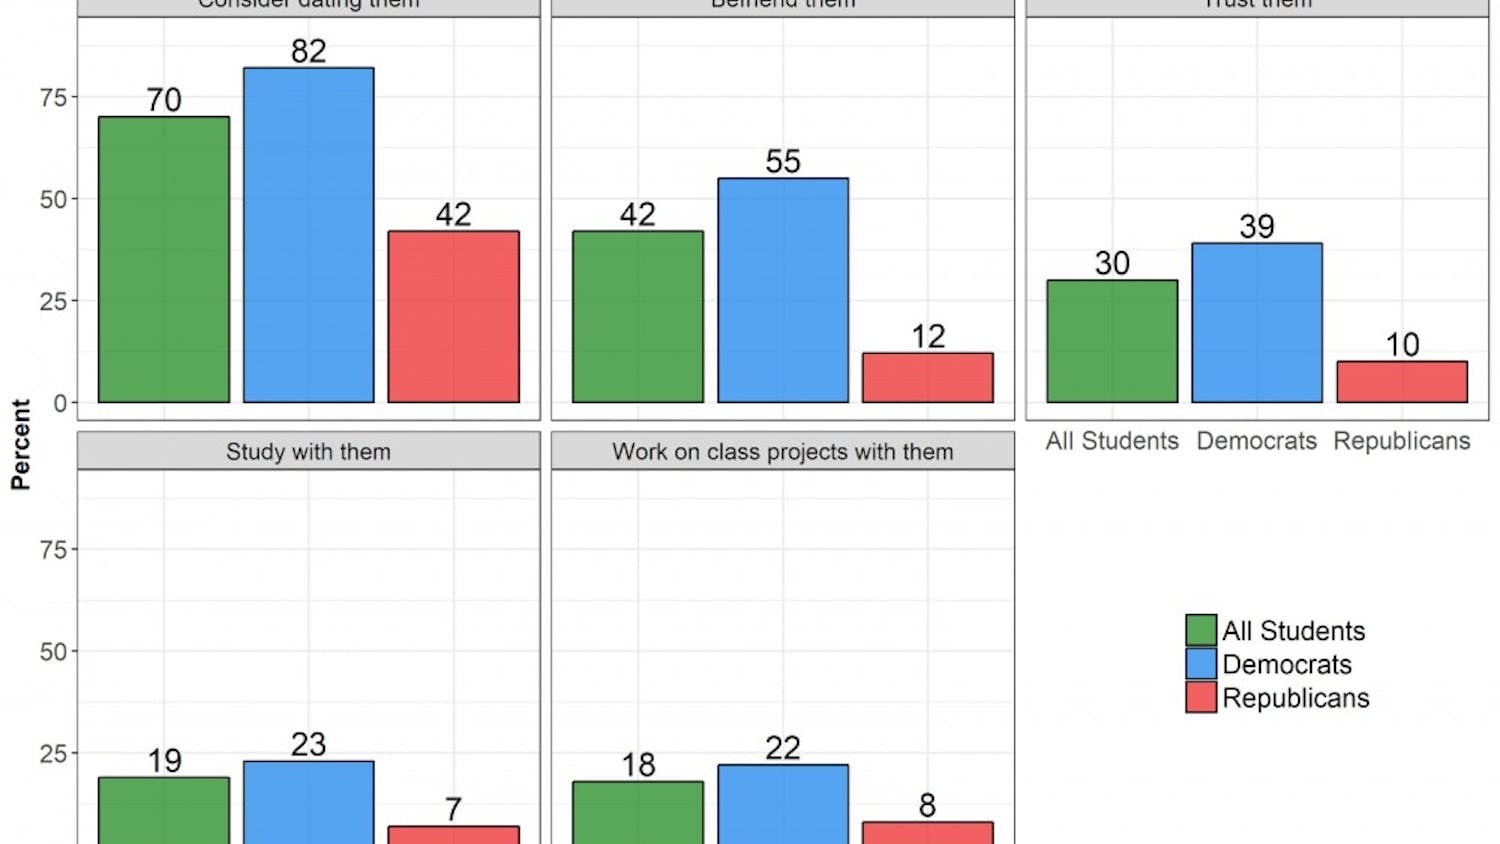
Like in previous years, students in the Class of 2019 indicate that their social networks generally follow their political views. Sixty percent say that all or most of their friends share the same political views that they do, while a further 34 percent say that some of their friends do. Those who are very liberal or very conservative are by far the most likely to report that all of their friends share their views. For the other frequencies (many, some, few, never), liberals are more likely to report that their friends share their political views; though in large part, this is likely because far more members of the Class of 2019 are liberal in the first place. Women are also significantly more likely than men to have friends with similar political views.
Post-Graduation Life
The Class of 2019 will land in similar states to previous classes, with New York (26 percent) representing the most popular destination, followed by Massachusetts (25 percent), California (15 percent) and Washington, D.C. (11 percent). One interesting discrepancy is that very few members of the Class of 2019 will be headed abroad, around one percent, while a much larger portion (five percent) of the Class of 2018 moved outside the U.S. after graduation.
The vast majority of the Class of 2019 will be headed directly for work after graduation. Seventy-three percent say that they plan to work after Dartmouth, while 20 percent will go to a medical, law or other graduate school. Compared to previous years, far more of the Class of 2019 will enter consulting, at 27 percent (eight percent for the Class of 2018), while far fewer will enter academia, at four percent (13 percent for the Class of 2018), and health, at 11 percent (eight percent for the Class of 2018). Twenty-two percent of 2019 seniors will enter finance, 14 percent will enter technology/engineering and eight percent will enter government/politics.
In terms of where the Class of 2019 would like to end up 10 years from now, the fields become very well-balanced. Government/politics was the most popular at 15 percent, and health at 11 percent. Ten percent of graduating seniors would like to end up in consulting, and a similar 10 percent for entrepreneurship; while nine percent of graduating seniors would like to work in each of academia and finance. Each of the popular initial fields — consulting, finance and engineering — saw significant decreases in desirability 10 years down the line, while the initially unpopular academia, health and government each saw huge increases in student count.

by William Chen and Aaron Lee / The Dartmouth
Overall, 31 percent of the Class of 2019 anticipate graduating with no debt, similar to the Class of 2018; of these students, the median debt was exactly $20,000, identical to that of the Class of 2018. Families’ financial backgrounds make a big difference in this regard — 49 percent of students whose families make less than $50,000 will graduate with no debt, while 89 percent of students with family incomes of over $200,000 will graduate with no debt. Forty-four percent of seniors indicate that they expect to receive financial assistance from their parents following graduation, while the remaining 56 percent will not. Again, students from higher income backgrounds are more likely to receive assistance, though not by much: 40 percent of students with family incomes below $50,000 expect to receive assistance, while 50 percent of students with family incomes above $200,000 expect to receive assistance.
Methodology
From Tuesday, May 28 to Wednesday, June 5, The Dartmouth fielded an online survey of Dartmouth senior students on their opinions and experiences at the school. The survey was sent out to 1,061 seniors through their school email addresses. 196 responses were recorded, resulting in a 18.5 percent response rate. Using administrative data from the College’s Office of Institutional Research, responses were weighted by Greek affiliation and race/ethnicity. Weighting was done through iterative post-stratification (raking). Survey results have a margin of error +/- 6.32.