
Issues of political discourse at universities have increasingly transcended U.S. college campuses and attracted national attention. Free speech has sparked the most debate, but equally important is how politics affect personal relations and academics more broadly — and whether it has as encompassing and divisive influence as many assume. The backdrop is a national political scene defined by partisan animus, which has been shown to shape people’s lives beyond politics. Given this climate and dynamics on campuses across the country, The Dartmouth fielded a survey to shed light on how these key issues manifest themselves at the College.
Politics and Social Relations
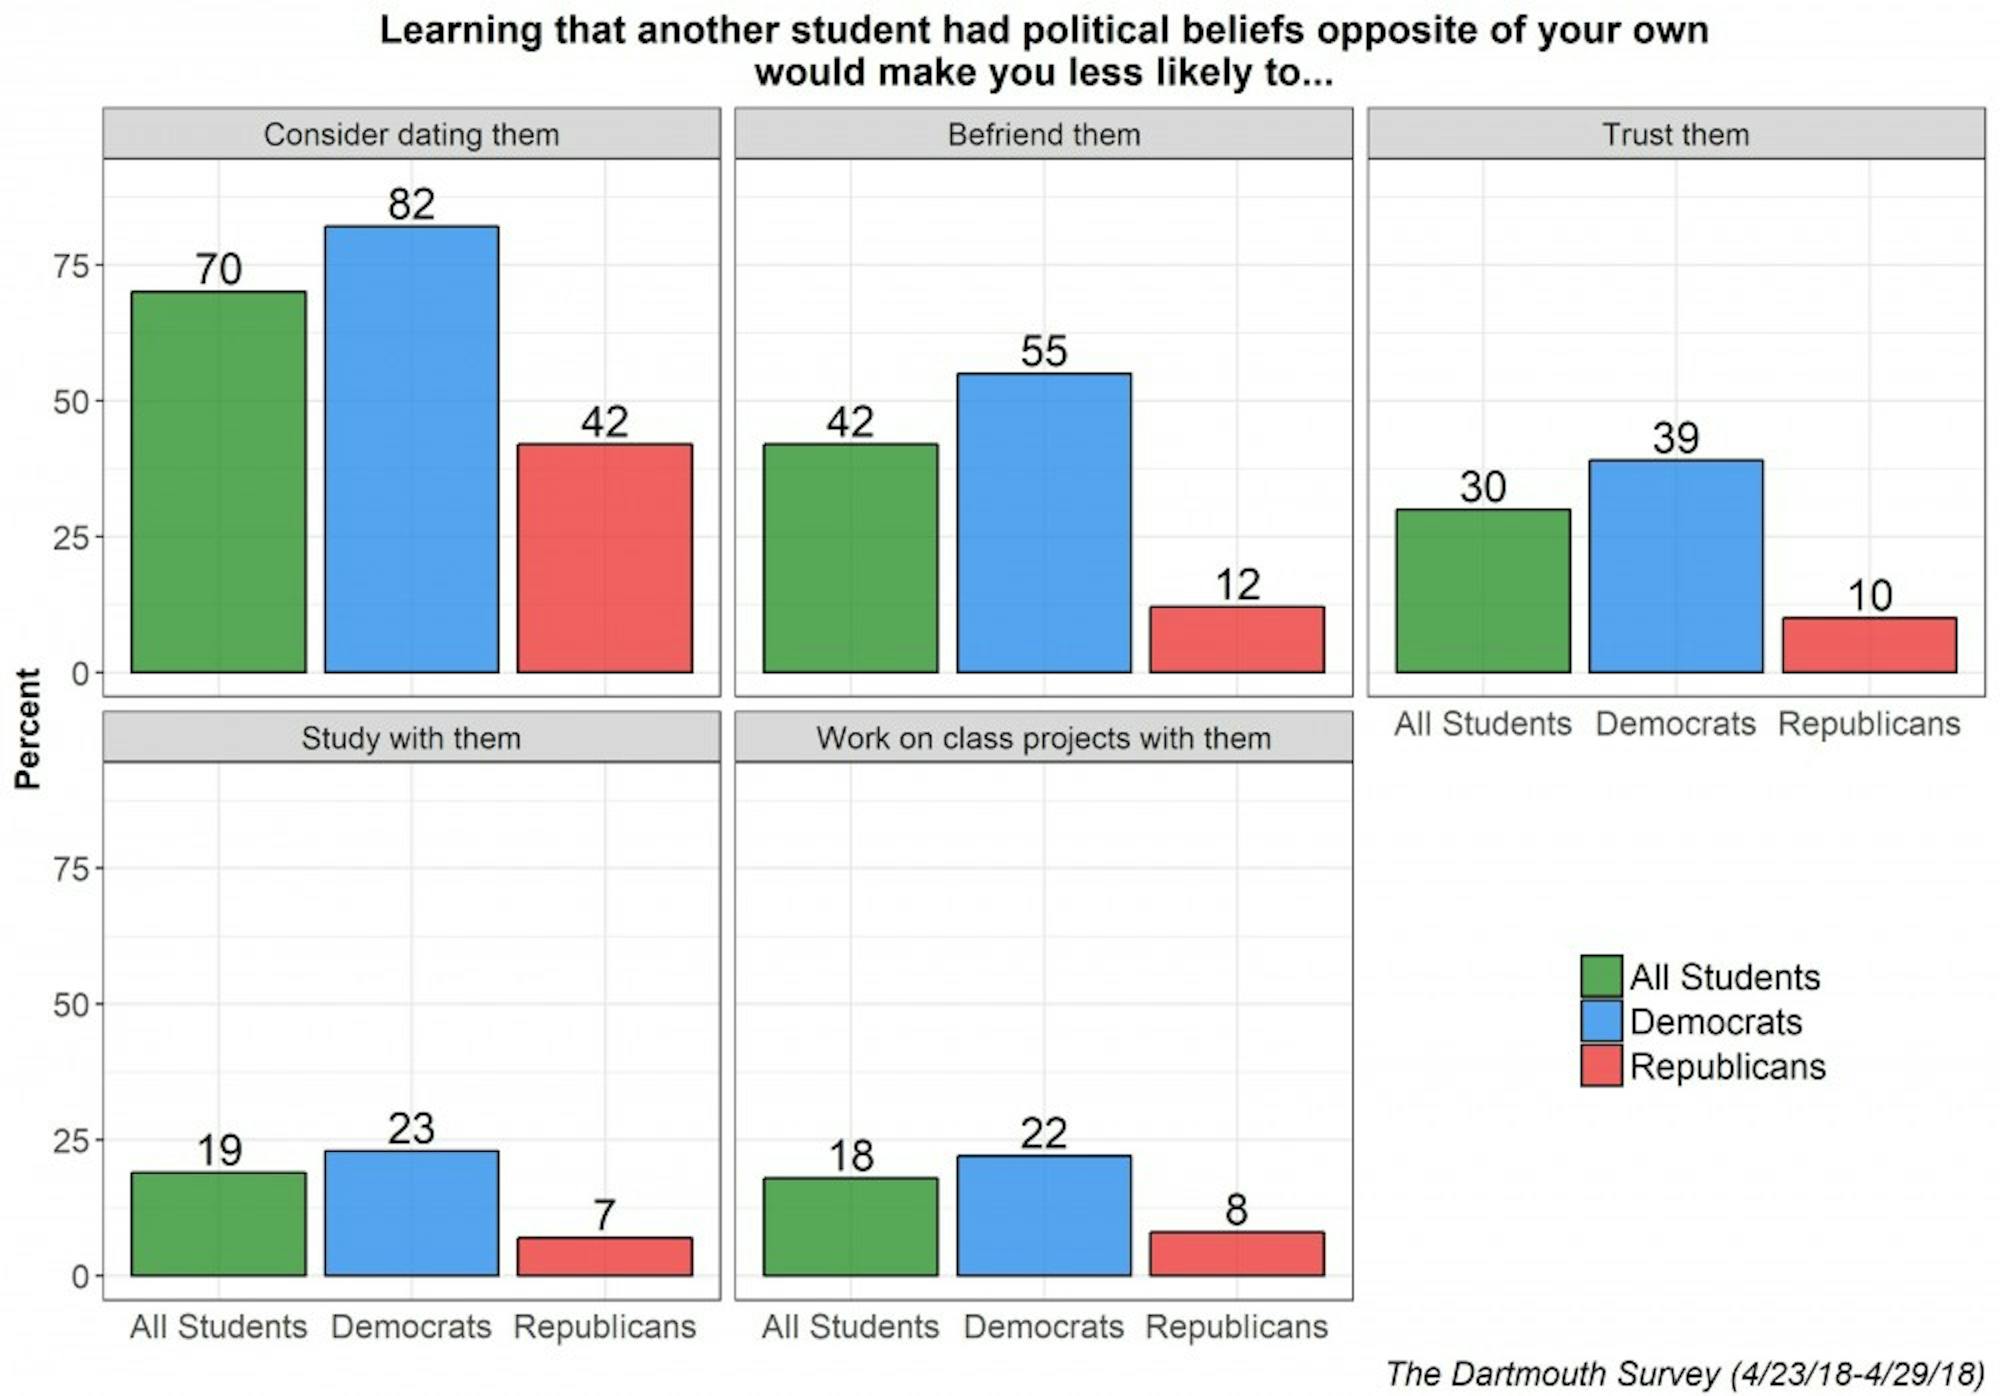
In the survey, undergraduates were asked if learning that another student had political beliefs opposite from their own would affect a range of possible interactions with them. Forty-two percent of respondents said that knowing this would make them less likely to befriend them, while 54 percent said it would make no difference. More than two-thirds of student respondents (70 percent) said they would be less likely to consider dating someone with opposite political beliefs from themselves. About a third (30 percent) said learning someone had opposite political beliefs would make them less likely to trust the person. The influence of personal politics does not permeate academics as much; only 19 percent of respondents said they would be less likely to study with someone with opposing political views, and for “working on class projects with them” it was 18 percent.
Overall percentages like these mask sizable partisan differences — Democrats were consistently more likely to indicate conflicting politics negatively affect potential relationships. While 82 percent of respondents who identified Democrats say they would be less likely to date someone with opposing political beliefs, only 47 percent of Independents and 42 percent of Republicans said the same. Similarly, 55 percent of Democratic respondents said opposite political views would make them less likely to befriend another student, compared to 21 percent of Independents and 12 percent of Republicans. Only gender plays nearly as strong of a role in dividing responses. For example, 83 percent of women said they would be less likely to date someone with opposing political views compared to 56 percent of men.
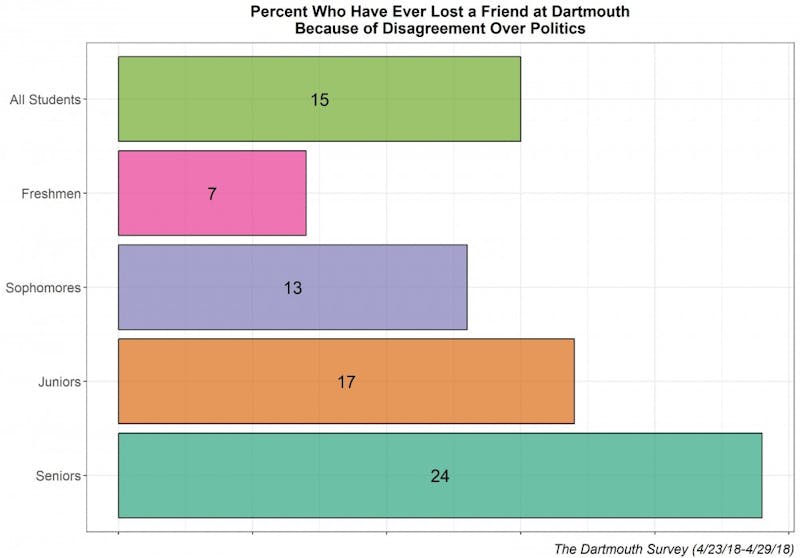
Is this influence of politics so pervasive that it determines whether friendships on campus last or end? Responses suggest it is not that damaging. When asked whether they ever lost a friend because of disagreement over politics at Dartmouth, 85 percent of respondents said no. However, the longer they have been at Dartmouth, the more likely a student is to have experienced this: 24 percent of senior respondents said they lost a friend over politics compared to 13 percent of sophomore respondents and seven percent of freshmen respondents.
Beyond relations between students, politics do not seem to seep into academic decisions. Students were asked whether knowing a professor’s political background would affect their likelihood of taking classes taught by the professor. Majorities of respondents said it would make “no difference” if they knew a professor was a Democrat, Republican, Libertarian or Socialist. About a quarter of respondents said that knowing a professor is a Republican (26 percent) or a Socialist (23 percent) would make them more unlikely to take a class. Fewer students indicate a Libertarian (16 percent) or Democratic professor (6 percent) would dissuade them from taking a class.
Democratic students express less willingness to take classes from a Republican professor (38 percent) than Republican students do to take a class taught by a Democratic professor (23 percent). Conversely, Republican respondents said they are more likely to take a class taught by a fellow Republican (51 percent) than Democrats do for a class taught by a fellow Democrat (22 percent). Perhaps distance from the out-group matters more for Democrats, while sticking with the in-group is more important for Republicans at Dartmouth.
Many of these questions lead to a general question: how much do politics factor into everyday life of students? Results show that politics are discussed a fair but not overwhelming amount. Forty-two percent of respondents said politics (current events and issues) are brought up “very often” or “often” during classes in their experience, 53 percent said the same for when they are talking with friends and 42 percent said the answer applied to clubs or organizations on campus. Compared to non-athletes, athletes at Dartmouth report politics coming up less when talking with friends and in clubs or organizations.
Free Speech
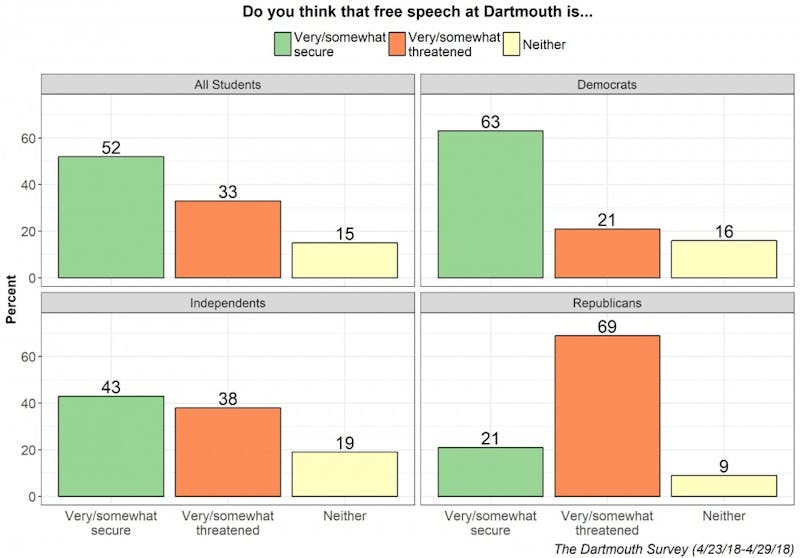
Issues of free speech are another important aspect of student relations on campus that have increasingly gained national attention. Earlier this year, the College was demoted to a “red light” status from its previous “yellow light” status by the Foundation for Individual Rights in Education, indicating a worsening state of free speech on campus. Vice president of policy research at FIRE Samantha Harris wrote in an email to The Dartmouth this past Feb. that the demotion was due to College’s Acceptable Use Policy, which “bans broad categories of speech, a great deal of which would be entitled to First Amendment protection at a public university.” Despite this, Dartmouth students do not think free speech is “under attack” on campus. Fifty-two percent of all survey respondents described free speech at Dartmouth as either very or somewhat secure, as opposed to 33 percent who call it very or somewhat threatened. Here, partisan fissures emerge again, as more than three times as many Republicans (69 percent) think free speech is threatened than do Democrats (21 percent).
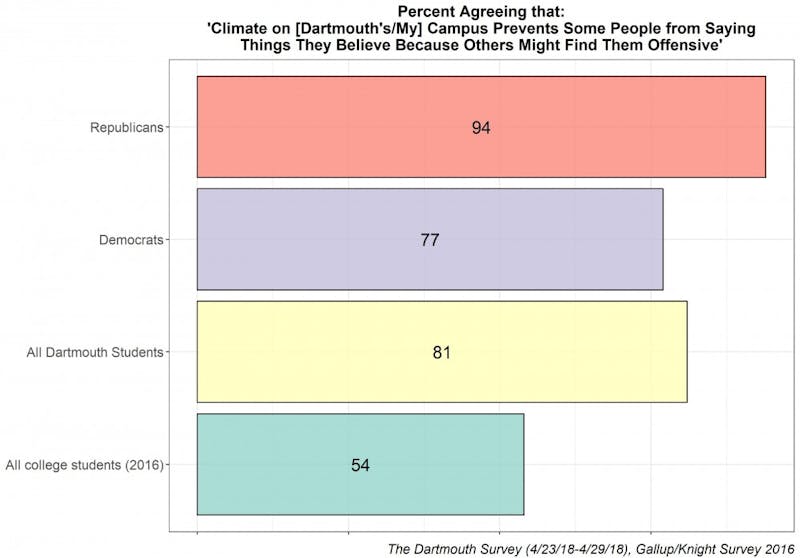
Responses to a related question about freedom of self-expression paints a somewhat different picture, however. When asked about whether “the climate on Dartmouth’s campus prevents some people from saying things they believe because others might find them offensive,” a large majority of respondents (81 percent) said they strongly or somewhat agree. Republicans (94 percent), white students (86 percent), men (87 percent) and students affiliated with Greek life (86 percent) are most likely to agree that such a limit exists campus speech. Despite these differences, large majorities across all subgroups — political or demographic — agree with the statement. The same question was also asked in 2016 of a nationally representative survey of U.S. college students regarding their respective college campuses: among students across the country, 54 percent agreed, far fewer than those at Dartmouth.
Students were also asked what type of environment is more important for Dartmouth to create: “a positive learning environment for all students by prohibiting certain speech or expression of viewpoints that are offensive or biased against certain groups of people” or “an open learning environment where students are exposed to all types of speech and viewpoints, even if it means allowing speech that is offensive or biased against certain groups of people.” Seventy-one percent of respondents said they prefer the open environment option. Students who are Republicans (94 percent), white (71 percent) and male (84 percent) were most likely to opt for the “open” option. A similar amount of students from across the country at 78 percent (from the 2016 survey) chose the open environment as well.
Partisan Contours
Dartmouth’s student body is about two-thirds Democrat (67 percent) with small minorities of Republican identifiers (19 percent) and Independents (14 percent), a distribution consistent with previous survey results at the College. Significant demographic divides appear only for gender and for athlete status. Surveyed women are 79 percent Democrat versus 12 percent Republican, while the divide among men is 55 percent and 27 percent, respectively. Athletes at the College are 52 percent Democrat versus 32 percent Republican, while the split is 71 percent to 16 percent for non-athletes. White Dartmouth students are not politically different from non-white students as a whole, but African-American students are more likely to be Democrats.
Methodology Notes
From Monday, Apr. 23 to Sunday, Apr. 29, The Dartmouth fielded an online survey of Dartmouth undergraduates about the role of politics in social life on campus. The survey was sent out to 4,412 students through their College email addresses. Four hundred ninety-eight responses were recorded, making for an 11.3 percent response rate. Using administrative data from the College’s Office of Institutional Research and other sources, responses were first weighted by Greek affiliation for all eligible (non-freshmen) students, then weighted by class year, gender, race/ethnicity, international student status and varsity athlete status for all students. Iterative post-stratification (raking) was the method used for weighting, done with the “survey” package in R. Survey results for the entire sample have a margin of error +/- 4.4. Subgroup differences are statistically significantly different from one another unless otherwise noted, and all reported differences hold in multivariate models.


