For the third year in a row, The Dartmouth conducted a survey that recorded the opinions and experiences of Dartmouth’s graduating seniors. Over the past four years, the Class of 2018 lived through many important events occurring on and off campus, all while navigating social and academic life at the school and preparing for the post-college future. The four sections below paint a picture of opinion on campus issues, facets of student life, relation to the national political scene and post-graduation life among members of the Class of 2018.
Campus Issues

The College administration and decisions it made regarding student life frequently faced criticism. After four years, that has translated into a negative view among seniors: 21 percent view the administration as a whole favorably, compared to 60 percent with an unfavorable view, and more view College President Phil Hanlon unfavorably (44 percent) than favorably (24). However, Hanlon’s image is not as unfavorable among 2018 seniors as it was with past classes: 60 percent of 2016 seniors and 58 percent of 2017 seniors had unfavorable views of Hanlon.
On specific policy areas, outgoing seniors similarly express distaste. On Moving Dartmouth Forward, more report an unfavorable view (58 percent) than a favorable one (18). The introduction of Housing Communities has not grown on seniors, as favorable-unfavorable percent split on the communities is 30-47. Fifty-three percent of seniors disagree that the hard alcohol ban — introduced during their freshman winters — has been successful in lowering high-risk drinking (28 percent agree). Overall, the graduating class has emerged wary of the administration’s influence, with 60 percent believing it should have a minimal role or no role in regulating student social life.
Several other issues have received plenty of attention as well, such as the state of Greek life on campus. More seniors view the Greek system favorably (49 percent) than unfavorably (35 percent). Affiliated seniors, unsurprisingly, are much more favorable toward the Greek system than unaffiliated ones, but some other divides arose too: seniors who identify as white and who identify as Republican, and those who on average had lower GPAs, view the Greek system more favorably. When assessing the state of the Greek system now compared to four years ago, a plurality of students (42 percent) don’t see a change for the better or worse.
When asked about satisfaction level with the amount of attention and resources devoted to preventing sexual assault on campus, similar numbers of seniors are satisfied (44 percent) as dissatisfied (39 percent), though female students express lower satisfaction. Similarly, overall, 44 percent of seniors believe sexual assault prevention efforts have been effective, while 46 percent say they have not been effective.
Resources for mental health issues among students have often been perceived as inadequate. Accordingly, more Class of 2018 members describe the quality of mental health resources that Dartmouth provides as poor or very poor (42 percent) than good or very good (24 percent), although another sizable amount (34) say these resources have been acceptable.
Lastly, seniors were also asked about faculty diversity, an issue that has proved a common point of criticism among students. More seniors describe the job that Dartmouth has done at promoting faculty diversity during the recruitment and tenure granting process as poor/very poor (42 percent) than good/very good (23), though many again say it has been acceptable (35). Seniors who are non-white, female, receiving financial aid and identify as Democrats are most likely to think Dartmouth has done a poor job at promoting faculty diversity.
In light of all of the controversial issues that arose over the last four years, perhaps seniors will now leave the College less willing to support it as graduates. When asked if they have become less likely to donate to Dartmouth after graduation because of campus controversies and actions by the administration, a plurality of seniors at 47 percent agreed with this statement, while 32 percent disagreed. A similar distribution — more seniors agreeing that they had become less willing to donate — appeared a year ago for the Class of 2017 as well. At the same time, 61 percent of Class of 2018 members do not believe that the various controversies have decreased the value of the degree they will earn.
Student Life

The Class of 2018 will leave Hanover with an overwhelmingly positive impression of the education they received — even more so than last year’s graduating class. Ninety-five percent say they are very or somewhat satisfied with the education they’ve received at Dartmouth. That rate is above the education satisfaction level among the Class of 2017 (88 percent) in last year’s survey, but identical to that for the Class of 2016. In terms of what shaped current seniors’ academic lives, 92 percent say academic interest influenced their choice of major/s at Dartmouth, and 60 percent point to preparation for a post-graduate career as having an influence. Many fewer say easiness of the major (nine percent) and pressure from parents/family (eight percent) were factors.
In assessing the importance of different components of their social lives, 75 percent of seniors describe clubs and organizations as being very/somewhat important to their social life at Dartmouth. That’s closely followed by Greek organizations (66 percent), while fewer seniors view off-campus events/venues (45 percent), Living Learning Communities (21 percent) and House Communities (six percent) as important.
One of the more popularized student traditions is the Dartmouth Seven, a set of seven locations on campus where students attempt to have sex. But much like for past graduating classes, most 2018 seniors have not completed even one of the acts by the end of their four years at Dartmouth. Sixty percent say they have not done any of the Dartmouth Seven, similar to the abstention rates for 2016 seniors, 55 percent, and 2017 seniors, 66 percent (both are not statistically significantly different from the 2018 rate). The most highly completed Dartmouth Seven act among the Class of 2018 was the Stacks (32 percent), followed by BEMA (20), the President’s Lawn (10), the 50-yard line (eight), the Steps of Dartmouth Hall (eight), the Top of the Hop (seven) and the Center of the Green (six). Out of all recorded demographics, only Greek affiliation was associated with completion levels: 53 percent of affiliated seniors have completed at least one of the Dartmouth Seven compared to 15 percent of unaffiliated ones.

Seniors were asked about a few other aspects of their romantic relationships over the last four years. About a quarter (28 percent) say they have never dated anyone while at Dartmouth, while a plurality of 42 percent say they have dated one person. Twenty-one percent say they have dated two people, and eight percent say three or more people. Thirty-nine percent of Class of 2018 members say they had sex for the first time while at Dartmouth, while 44 percent say they did it before Dartmouth and 17 percent say they have never done it at all. A few more “firsts” were also asked about on the survey: 35 percent say they drank alcohol for the first time while at Dartmouth, many fewer than the 58 percent already having done so coming into the College. Forty percent report using drugs/substances for the first time while at Dartmouth.
Across nearly every specific type of substance asked about, most seniors have never used it while at Dartmouth. Only 34 percent say they have ever used tobacco while at Dartmouth, 27 percent say the same for cocaine, 20 percent say so for non-prescribed study drugs, and 10 percent say so for LSD. The only exception is marijuana: 62 percent of seniors report ever using marijuana while at Dartmouth, with 17 percent saying very often/often.
National Politics

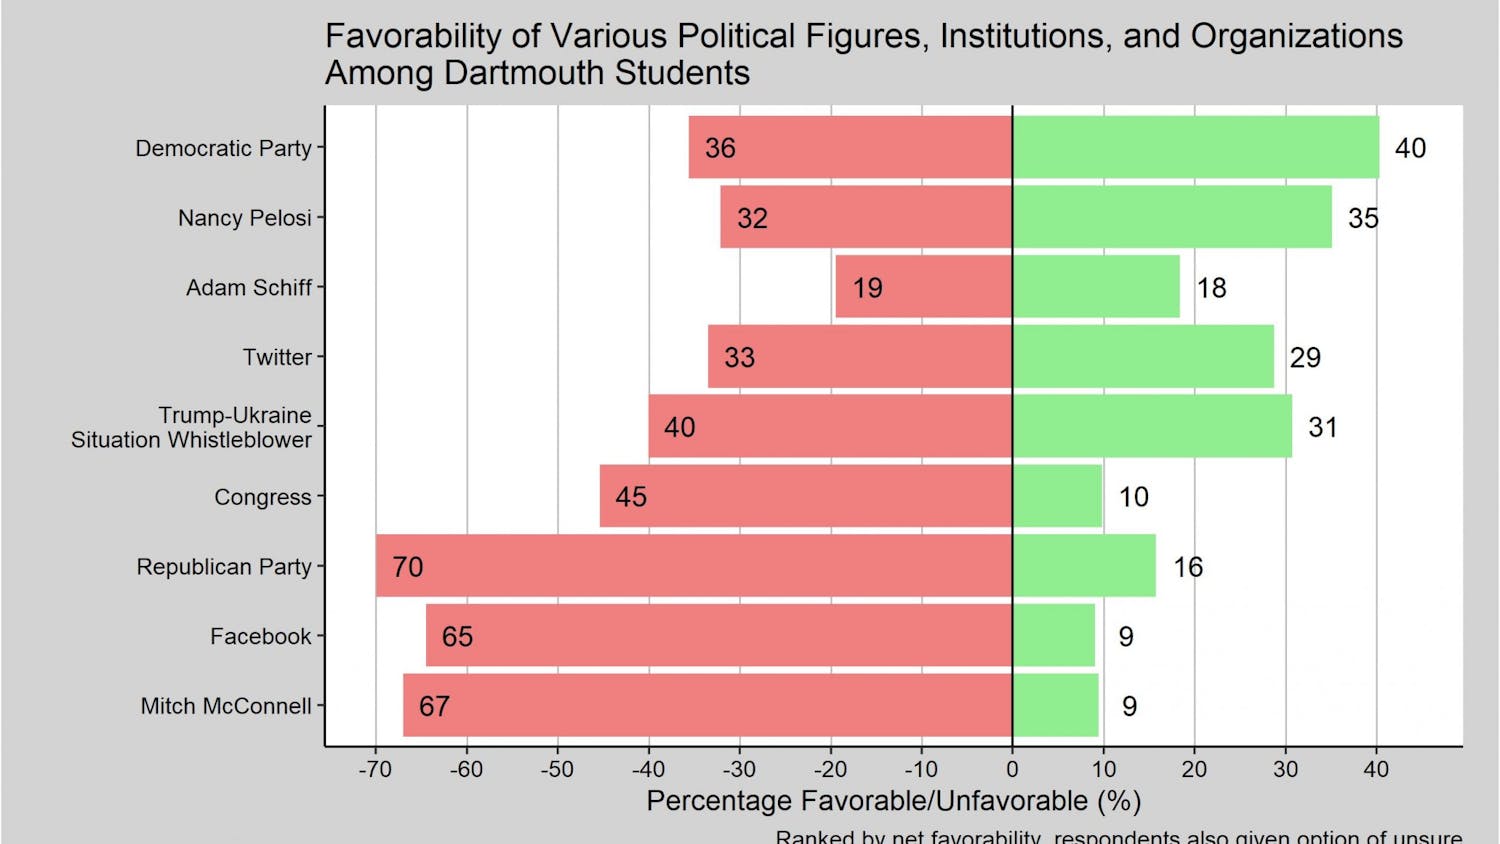
During their time on campus, the Class of 2018 will have lived through a divisive presidential campaign followed by a dynamic post-election period. A majority of seniors, at 64 percent, identify as Democrat — very similar to the 67 percent of 2017 seniors and 69 percent of 2016 seniors that did so in past surveys — compared to 19 percent Republican and 17 percent Independent among the Class of 2018. With this predominantly Democratic tilt, it comes as no surprise that nearly four in five seniors (79 percent) say things in this country today are off on the wrong track. That certainly reflects disapproval with the current political climate and presidency, as 85 percent of seniors have an unfavorable view of Donald Trump. Partisanship divides views on Trump most, but even when accounting for this, senior women at Dartmouth have a more unfavorable view of Trump (97 percent) than men do (74 percent). Senior athletes are also more favorable toward Trump than non-athletes are.
The Class of 2018 also expressed its opinion on various other institutions and groups in the U.S. The #MeToo movement has been one of the most important social developments in the last year, and a large majority of Dartmouth seniors view it favorably (73 percent). Seniors who are Democrats, female and affiliated in particular view it most positively. As part of the allure of job prospects, Wall Street often attracts attention among Dartmouth students, but it doesn’t receive too high of a mark from seniors. More view Wall Street unfavorably (47 percent) than favorably (26), with Republican and male seniors having the most favorable views of it. The overall unfavorable view contrasts from the Class of 2017’s perception, as 53 percent of last year’s seniors viewed Wall Street favorably (27 percent unfavorably).
Seniors were also asked about a few more personal aspects of their political life. A majority of seniors indicate that their social network at Dartmouth closely resembled their own political leanings: 55 percent say all or most of their closest friends share the same or similar political beliefs as they do, while 30 percent say some of their friends do. Seniors who identify as Democrat and are women are most likely to report having politically similar friends.
Many often view College as a transformative period for young peoples’ political beliefs. To speak to this possible phenomenon, seniors were asked to describe their political viewpoint before coming to Dartmouth and what their ideology is now. To the extent that they can reliably remember their pre-college political outlook, seniors appear to have drifted in a more liberal direction over the last four years. Coming into Dartmouth, 20 percent of seniors described their views as very liberal; now, however, 34 percent say so. That mirrors a similar jump that the Class of 2017 observed for itself in last year’s survey: 2017 seniors went from 17 percent very liberal before Dartmouth to 30 percent after.
Post-Graduation Life
The Class of 2018 has a diverse path ahead of it after graduation. Many recent graduates won’t be living too far away from each other, however. About one-third of seniors (30 percent) say they will be living in some part of New England after graduation. Massachusetts (23 percent) and New York (21 percent) represent the two most popular destinations for recent grads, followed by California (13), going outside the U.S. (5) and staying in New Hampshire (4), while five percent say they are not sure where they’ll be.
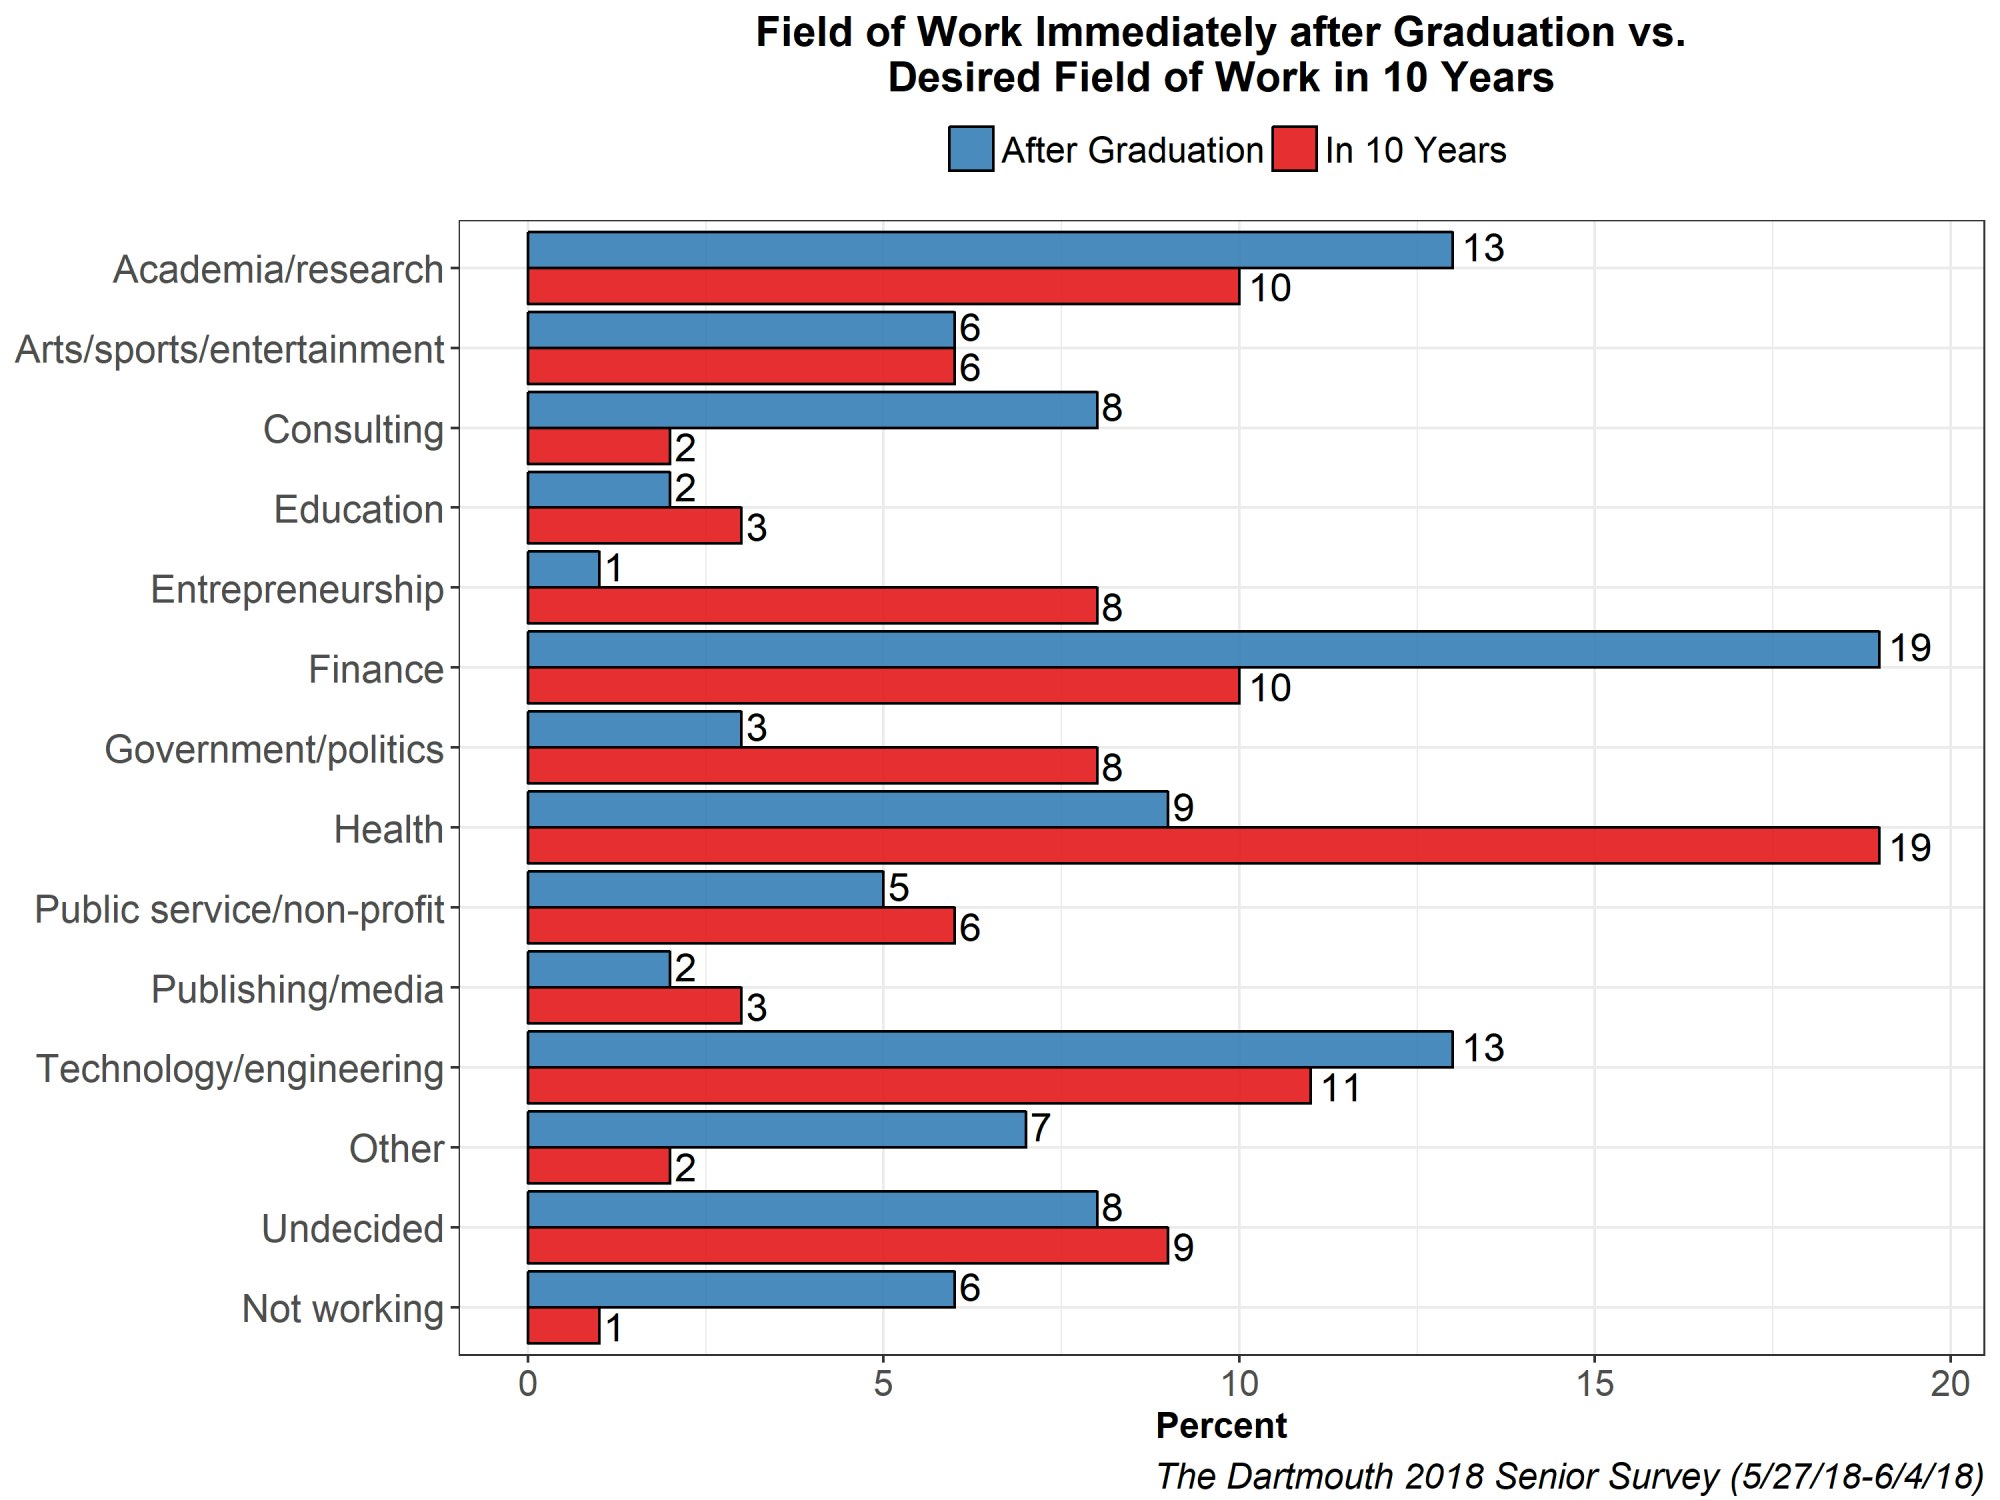
A majority of seniors will enter the workforce right away at 59 percent, while 18 percent will start at a graduate or professional school and 10 percent report that they will take a gap year. In terms of specific fields they will be entering immediately after graduation, 19 percent of seniors will work in finance, 13 percent in technology/engineering, 13 percent in academia/research, nine percent in health and eight percent in consulting. The latter figure marks a dropoff from the 2017 and 2016 senior classes, as 17 percent in each reported going into consulting — more than in the Class of 2018.
Starting salaries among seniors vary a good amount, with 24 percent saying they will make $50,000 or less, 30 percent saying they will make between $50,000 and $100,000 and 13 percent saying they will earn $100,000 or more — more than the five percent of 2017 seniors with starting salaries of $100,000 plus. Many seniors are not sure (19 percent) or are not working (12). Dartmouth seniors who come from high income backgrounds (families with yearly household incomes of over $200,000) will now make more money right out of college: 52 percent of high income background seniors will have a starting salary of $50,000 or greater, while only 32 percent of low-income background seniors will do so.
Family background also figures into seniors’ post-graduation lives to some extent. Thirty-six percent say their family’s financial situation affected their post-graduation plans a lot or a moderate amount, while 28 percent say a little and 36 percent say not at all. Seniors from high income backgrounds (48 percent) are more likely to indicate no effect at all. Only 28 percent of seniors expect to receive financial assistance from their parents for rent/living expenses after graduation; 50 percent do not, and another 23 percent are not sure.
As for other notable post-graduation financial conditions, 33 percent of seniors say they are graduating in debt due to college-related expenses. Only 28 seniors reported an actual debt total they were graduating with, and among these, the median debt was $20,000.
Methodology Notes:
From Sunday, May 27 to Monday, June 4, The Dartmouth fielded an online survey of Dartmouth senior students on their opinions and experiences at the school. The survey was sent out to 1,105 seniors through their school email addresses. 171 responses were recorded, making for a 15.5 percent response rate. Using administrative data from the College’s Office of Institutional Research and other sources, responses were weighted by gender, race/ethnicity, Greek affiliation and international student status. Iterative post-stratification (raking) was the method used for weighting, done with the “survey” package in R. Survey results for the entire sample have a margin of error +/- 7. Subgroup differences are statistically significantly different from one another unless otherwise noted, and all reported differences hold in multivariate models. Reported percentages may not add up to 100 due to rounding or because of exclusion of certain answers (“Not sure,” “Neither,” etc.).