This article is featured in the 2017 Commencement & Reunions Issue.
For the second year in a row, The Dartmouth conducted a survey on the beliefs and experiences of Dartmouth’s graduating class. Over the past four years, the Class of 2017 has lived through a pivotal period for the direction of the school, a much-discussed time for college students across the nation and a historic election period. All of this makes the task of cataloguing the outgoing class’s life at the school an important one. Of the 1,084 seniors, 261 students responded for a response rate of just over 24 percent. Below are four sections that the Class of 2017 was surveyed about: opinion on issues and figures related to Dartmouth (I), student life experiences (II), opinions related to politics more broadly (III) and post-graduation plans (IV).
I. Dartmouth Issues

Several actions taken by the College have received widespread scrutiny. For the Class of 2017, that has translated into a decisively negative view of College President Phil Hanlon, with just 22 percent of students viewing him favorably compared to 58 percent viewing him unfavorably. The administration as a whole gets much worse marks, with 81 percent of seniors having an unfavorable opinion. Asking about specific administrators makes some of this negativity dissipate — 15/34 favorable/unfavorable percentages for Dean of the College Rebecca Biron and 8/33 for Provost Carolyn Dever — but likely due to unfamiliarity (most students weren’t sure about or apathetic towards them). When asked about the role the administration should have in regulating student life, seniors are divided: 46 percent answered that it should have a large or some role, while 53 percent said a minimal role or none at all.
A few of the more notable actions taken by the College see mixed reactions from seniors. The Moving Dartmouth Forward initiative, introduced by Hanlon, is viewed unfavorably by 66 percent of the graduating class (just 14 percent express a favorable view). Related policies are not plagued by as much opposition however. Seniors are split in their opinion on the new housing system (40 percent support versus 40 percent oppose). Forty-one percent supported the abolishment of pledge terms at fraternities that was introduced in 2014, while 33 percent opposed it. Two high profile fraternity derecognitions are seen as largely positive: 47 support the 2016 derecognition of Sigma Alpha Epsilon (32 percent oppose it), and 55 percent support the 2015 derecognition of Alpha Delta (26 percent in opposition).
Sexual assault policy has proved a very salient issue over the last four years. Fifty-one percent of seniors thought sexual assault prevention efforts were not very effective or not at all effective during their time at Dartmouth; 31 percent said they were somewhat effective and only 4 percent said very effective. More students were also dissatisfied (45 percent) with the amount of attention and resources devoted to preventing sexual assault from the College and other organizations than were satisfied (35 percent).
Another noteworthy administrative action during the seniors’ time at Dartmouth was the 2015 hard alcohol ban that came as part of MDF, the effectiveness of which has often come under question. Accordingly, 58 percent of seniors disagree with the idea that the ban has been successful in lowering high-risk drinking on campus compared to 30 percent who agreed. Moreover, 78 percent of seniors reported consuming hard alcohol on campus — in other words, violating the ban — since the policy’s implementation in January 2015.
Concern over many of these issues has often been driven in part by the potential harm they could do to outside perception of Dartmouth. To that end, seniors were asked if the various controversies that have occurred at Dartmouth in the last four years have decreased the value of the degree they’ll earn. For the most part, however, they did not believe this to be the case: 53 percent disagreed with this notion while 30 percent agreed. At the same time, that hardly means seniors have forgotten about these issues. Fifty-six percent agree that because of campus controversies and actions by the administration during their time at Dartmouth, they have become less likely to donate to the school after graduation, while 25 percent disagree.
Finally, seniors were also asked their opinion on a few other important institutions on campus. Given the student body tilts much more left-leaning as a whole, it should come as no surprise that the College Democrats are viewed more positively (44 percent favorably versus 14 percent unfavorable) than are College Republicans (14 versus 56). The Black Lives Matter movement has sparked much debate on campus over the past few years. Despite a supposed polarizing image, more seniors view the movement favorably at 47 percent than unfavorably at 33 percent. The Divest Dartmouth movement has also been very active during the time the Class of 2017 has been on campus; seniors largely view the group more favorably (52 percent) than unfavorably (20 percent).
A few more miscellaneous areas round out the Dartmouth-related opinion questions. Of the two main publications on campus, The Dartmouth sees a more positive favorable/unfavorable split among seniors (46/24) than does the Dartmouth Review (14/67). Seniors are divided on the dining services on campus, Dartmouth Dining Services, with 41 percent each viewing it favorably and unfavorably. Lastly, the graduating class has an overwhelmingly positive view of faculty at Dartmouth, with 92 percent having a favorable opinion.
II. Student Life Experiences

When looking back at the education they received at Dartmouth, seniors by and large express content. Eighty-eight percent were very or somewhat satisfied with the education they received, while only 8 percent indicated dissatisfaction with this aspect of their time as students. Perhaps that makes it unsurprising how prominently academics have figured into the lives of seniors: 98 percent said academics were important during their time at Dartmouth, with 75 percent indicating academics were “very important.” That mark far surpasses rankings for other aspects of student life. In the order of importance, social life, extracurriculars, traditions, paid employment, Greek life and varsity sports followed academics — which was most highly ranked. Seniors were also asked how important five big milestones were to their experience at Dartmouth. Sophomore summer proved the experience ranked most important, with 57 percent calling it very important. First-Year Trips followed next at 47 percent, after which came Green Key (33 percent), Homecoming (30 percent) and Winter Carnival (17 percent). The Dartmouth Seven represents another one of these popularized student traditions at Dartmouth, consisting of seven campus locations at which students attempt to have sex. Sixty-six percent of seniors said they did not complete any of these seven acts. The stacks had the highest completion rate at 29 percent, followed by BEMA (18 percent), the 50-yard line (11), the middle of the Green (10), the President’s lawn (10), the steps of the Dartmouth Hall (8) and the Top of the Hop (7). Though about two of every three seniors didn’t participate in the Dartmouth Seven, that didn’t mean they abstained from sex entirely; 80 percent of students reported having at least one sexual partner while at Dartmouth, with a median of two partners per student.
One set of questions was asked of seniors on the general topic of sexuality. Seniors were asked both about their current sexual orientation and their orientation before coming to Dartmouth. While 91 percent reported being heterosexual or straight before Dartmouth, 82 percent said they were heterosexual or straight as of right now.
Continuing on the topic of student life experiences, seniors were asked about various substances and activities they engaged in while at Dartmouth. Thirty-eight percent of the Class of 2017 said they drank alcohol for the first time while at Dartmouth, while 34 percent said they used drugs or illicit substances and 47 percent they engaged in sexual activity for the first time.
Seniors also answered how often they used five different illicit substances while at Dartmouth. Marijuana proved the most frequently used with 31 percent of seniors indicating they used it at least once a month if not more. The next most commonly used substance (at least once a month) was tobacco at 15 percent. Seventeen percent of seniors reported using non-prescribed study drugs at least at one point while at Dartmouth; 15 percent said so for cocaine and only 8 percent for LSD.
III. American Politics
While attending Dartmouth for the last four years, the Class of 2017 has lived through a very tumultuous period in American politics, an unexpected election result and a passionate post-election response.
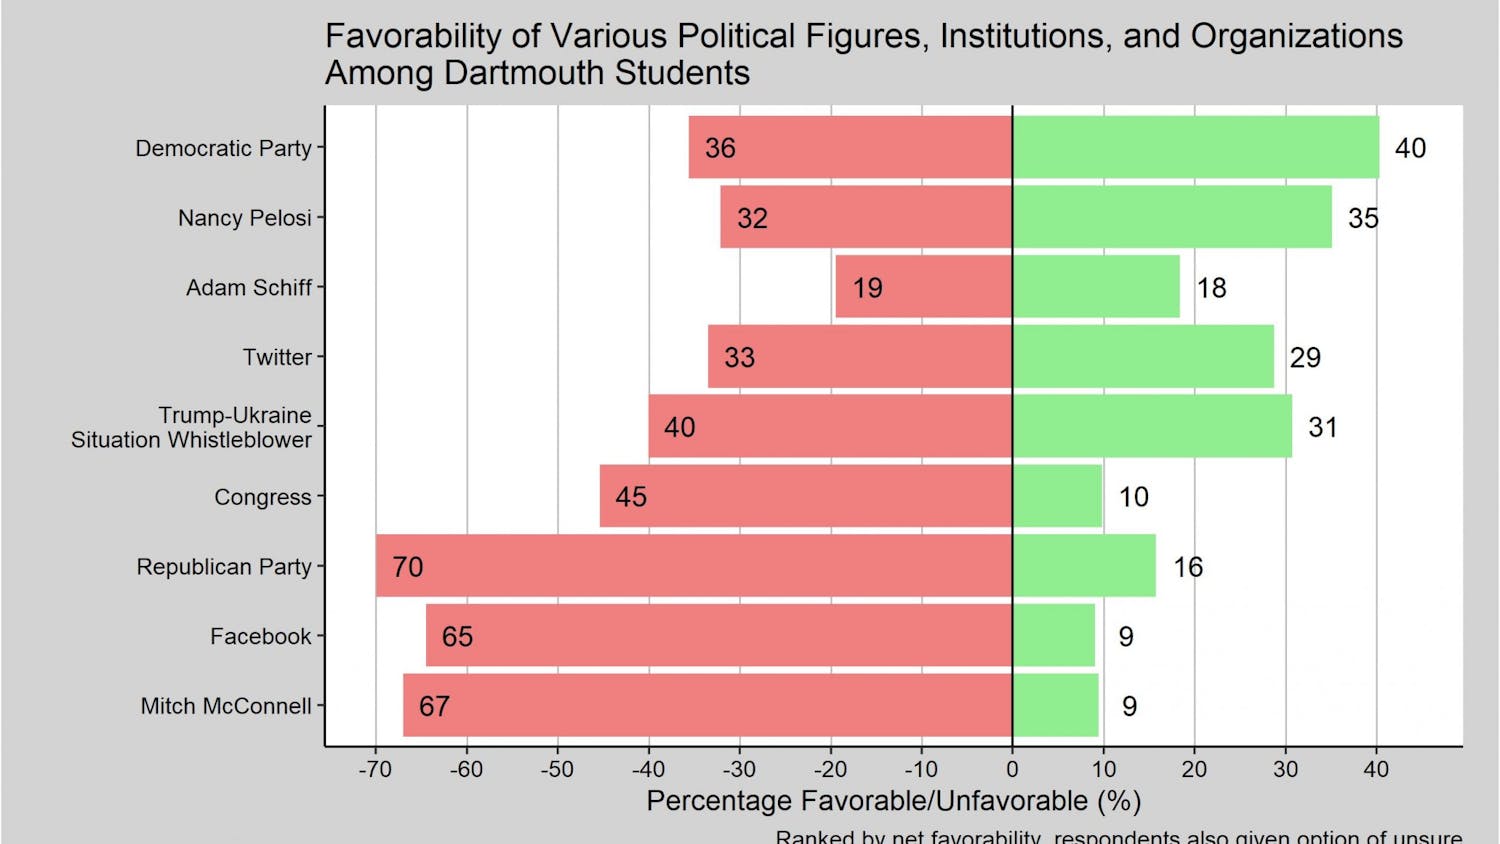
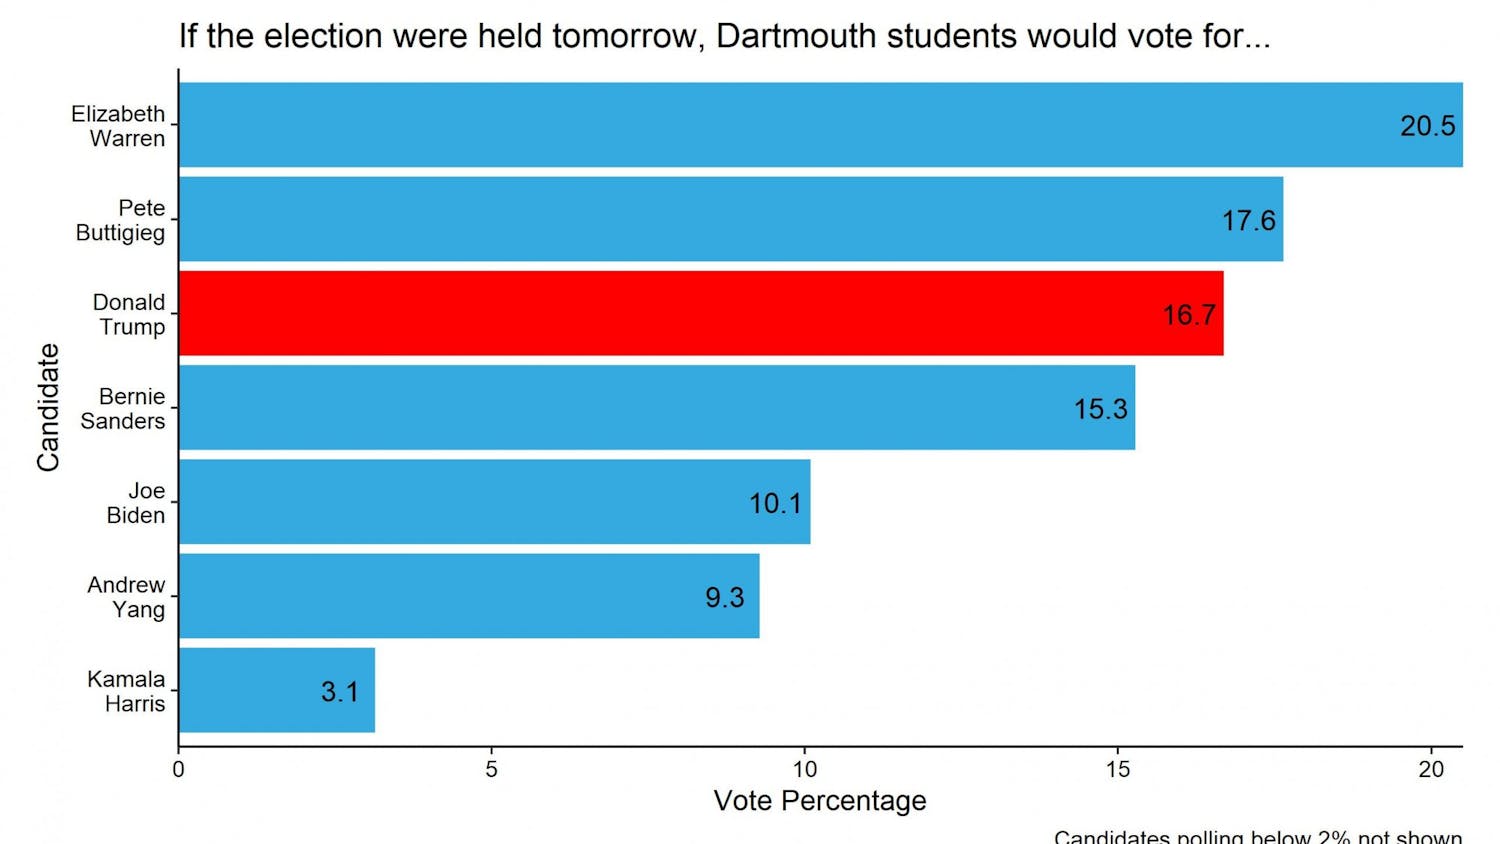
In closely matching past student survey results, the partisan distribution of the graduating class was very Democratic: 67 percent of seniors identified as Democrats, 21 percent as Republicans and 12 percent as Independents. The heavy Democratic makeup understandably shaped student perceptions of key American political and social figures. President Donald Trump was widely detested by the senior class, with 90 percent expressing an unfavorable view — and 78 percent saying they had a very unfavorable view — compared to just 6 percent with a favorable perception. Interestingly, seniors seemed to distinguish between Trump and the party he now leads. Perceptions toward the Republican Party as a whole prove somewhat less hostile — 17 percent of seniors express a favorable view of the party compared to 72 percent with an unfavorable view. A less well-known Republican figure closer to home in New Hampshire Governor Chris Sununu drew less of a response (70 percent had no opinion or weren’t sure about him) but received more unfavorable views (20 percent) than favorable ones (nine percent).
For figures and institutions on the Democratic side, the Class of 2017 was much more supportive. Former President Barack Obama received the best marks of any figure surveyed on either side, with 78 percent of seniors viewing him favorably and just 13 percent registering an unfavorable view. Former presidential candidate and current Vermont Senator Bernie Sanders (62 percent favorable versus 28 percent unfavorable), former Democratic presidential nominee Hillary Clinton (56 versus 29) and the Democratic Party as a whole (57 versus 27) received about the same ratings. Seniors viewed U.S. Congress much more unfavorably at 63 percent than favorably at 13 percent. When asked about Wall Street, 53 percent of seniors had a favorable view compared to 27 percent expressing an unfavorable view.

Following the 2016 presidential election, there was speculation on the impact the results could have on political engagement, particularly that of younger Americans. While most seniors said the 2016 election has had no impact on their willingness to run for political office, 30 percent did say the election made them more likely to do so. The biggest impact of the election seems to have materialized in how much seniors pay attention to political news, with 72 percent report being more likely to pay attention because of the election. Fifty-eight percent say they’ve become more likely to take part in a protest, march or demonstration, and 34 percent say they’ve now become more likely to seek work in politics as a result of the election. As for more immediate election effects, 25 percent of the Class of 2017 say they have participated in the Women’s March, March for Science or any other protest or march since the 2017 presidential inauguration.
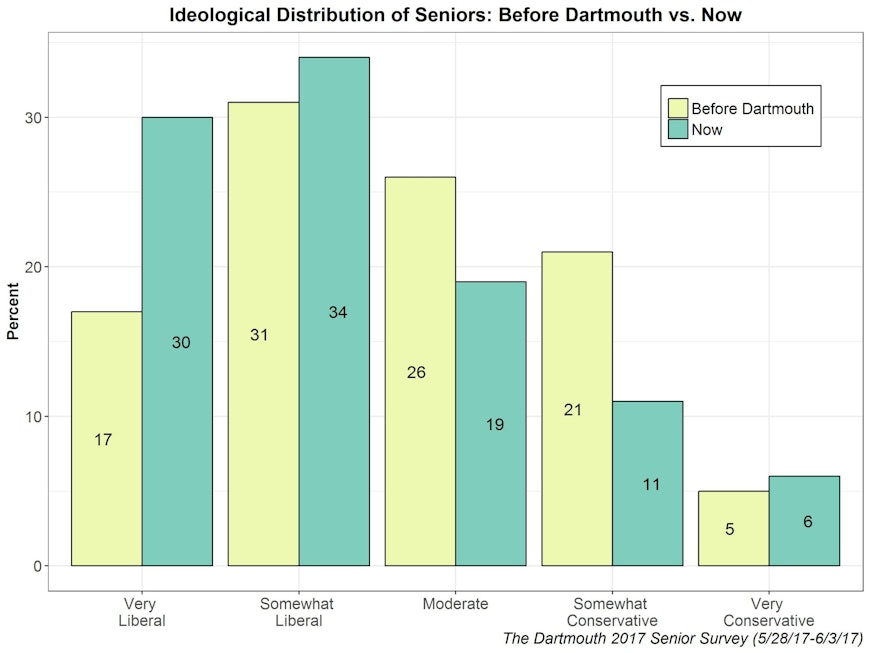
Answers to ideological leanings before and after Dartmouth reveals that seniors’ time at the school may have made them more liberal. While 48 percent describe their viewpoint as liberal and 26 percent as conservative before coming to Dartmouth, 64 percent see themselves as liberal and 17 percent as conservative as of right now. One of the bigger jumps occurs within those classifying themselves as very liberal: 17 percent were ideologically very liberal before Dartmouth and 30 percent were very liberal after.
Freedom of speech on campus and particularly in the classroom has spawned concern among some in the American public. In speaking to this issue, 64 percent of seniors said they have at some point chosen not to express an opinion in an academic setting out of fear it would offend others.
IV. Post-Graduation Plans

After graduation, the Class of 2017 will set out on various different career trajectories. In terms of where they’ll be living post-graduation, seniors will concentrate on both coasts: 22 percent say they’ll be living in New York, 18 percent in Massachusetts, 13 percent in California, 9 percent outside the U.S., 8 percent in Washington, D.C. and 7 percent will stay in New Hampshire. A majority, at 56 percent, plan to enter the workforce after graduation, with the next most common option being graduate school with 17 percent of seniors continuing their higher education. Seven percent were still not sure of their future plans and another 7 percent are taking a gap year.
Starting salaries among seniors who will be earning one right out of graduation vary, but the median salary range is $50,000-75,000. Sixteen percent of seniors fall in this range, while 21 percent each fall in $25,000-50,000 and $75,000-$100,000 intervals; 10 percent will be earning less than under $25,000 while 5 percent will be earning more than $100,000. Thirteen percent of seniors report that they won’t be working after graduation.
Seniors were asked both what field they will be working in immediately after graduation, as well as the field in which they would like to be working in 10 years. Consulting proved the most common occupation immediately out of Dartmouth with 17 percent of students entering the profession. However, only 1 percent of surveyed senior students would like to be working in consulting in 10 years. The field of finance sees a similar dynamic, with 9 percent working in finance immediately after graduation while 5 percent want to be in the field in 10 years. Three fields see reversed trends: health (7 percent of seniors working in it after graduation compared to 14 percent wanting to do so in 10 years), government and politics (2 percent versus 14 percent) and entrepreneurship (2 percent versus 10 percent).
Methodology Notes:
From Sunday, May 28 to Saturday, June 3, The Dartmouth fielded an online survey of Dartmouth senior students on their opinions and experiences at the school. The survey was sent out to 1,084 seniors through their school email addresses. 261 responses were recorded, making for a 24.1 percent response rate. Using administrative data from the College’s Office of Institutional Research, responses were weighted by gender, Greek affiliation, race/ethnicity and international student status. Iterative post-stratification (raking) was the method used for weighting. Survey results have a margin of error +/- 5.29.
Note: Reported percentages may not add up to 100 due to rounding.