Summary:
- Vote intention of students: Clinton 65.9, Johnson 13.6, Trump 6.3, Stein 2.8
- Favorability ratings: Clinton +18.9, Trump -89.1, Johnson +1.7, Stein -6.3
- 77 percent of students are dissatisfied with candidate options
- Plurality of students at 40.1 percent voting mostly against Trump
- 58.1 percent of students predict a narrow Clinton victory
- President Barack Obama net approval rating: +55.4
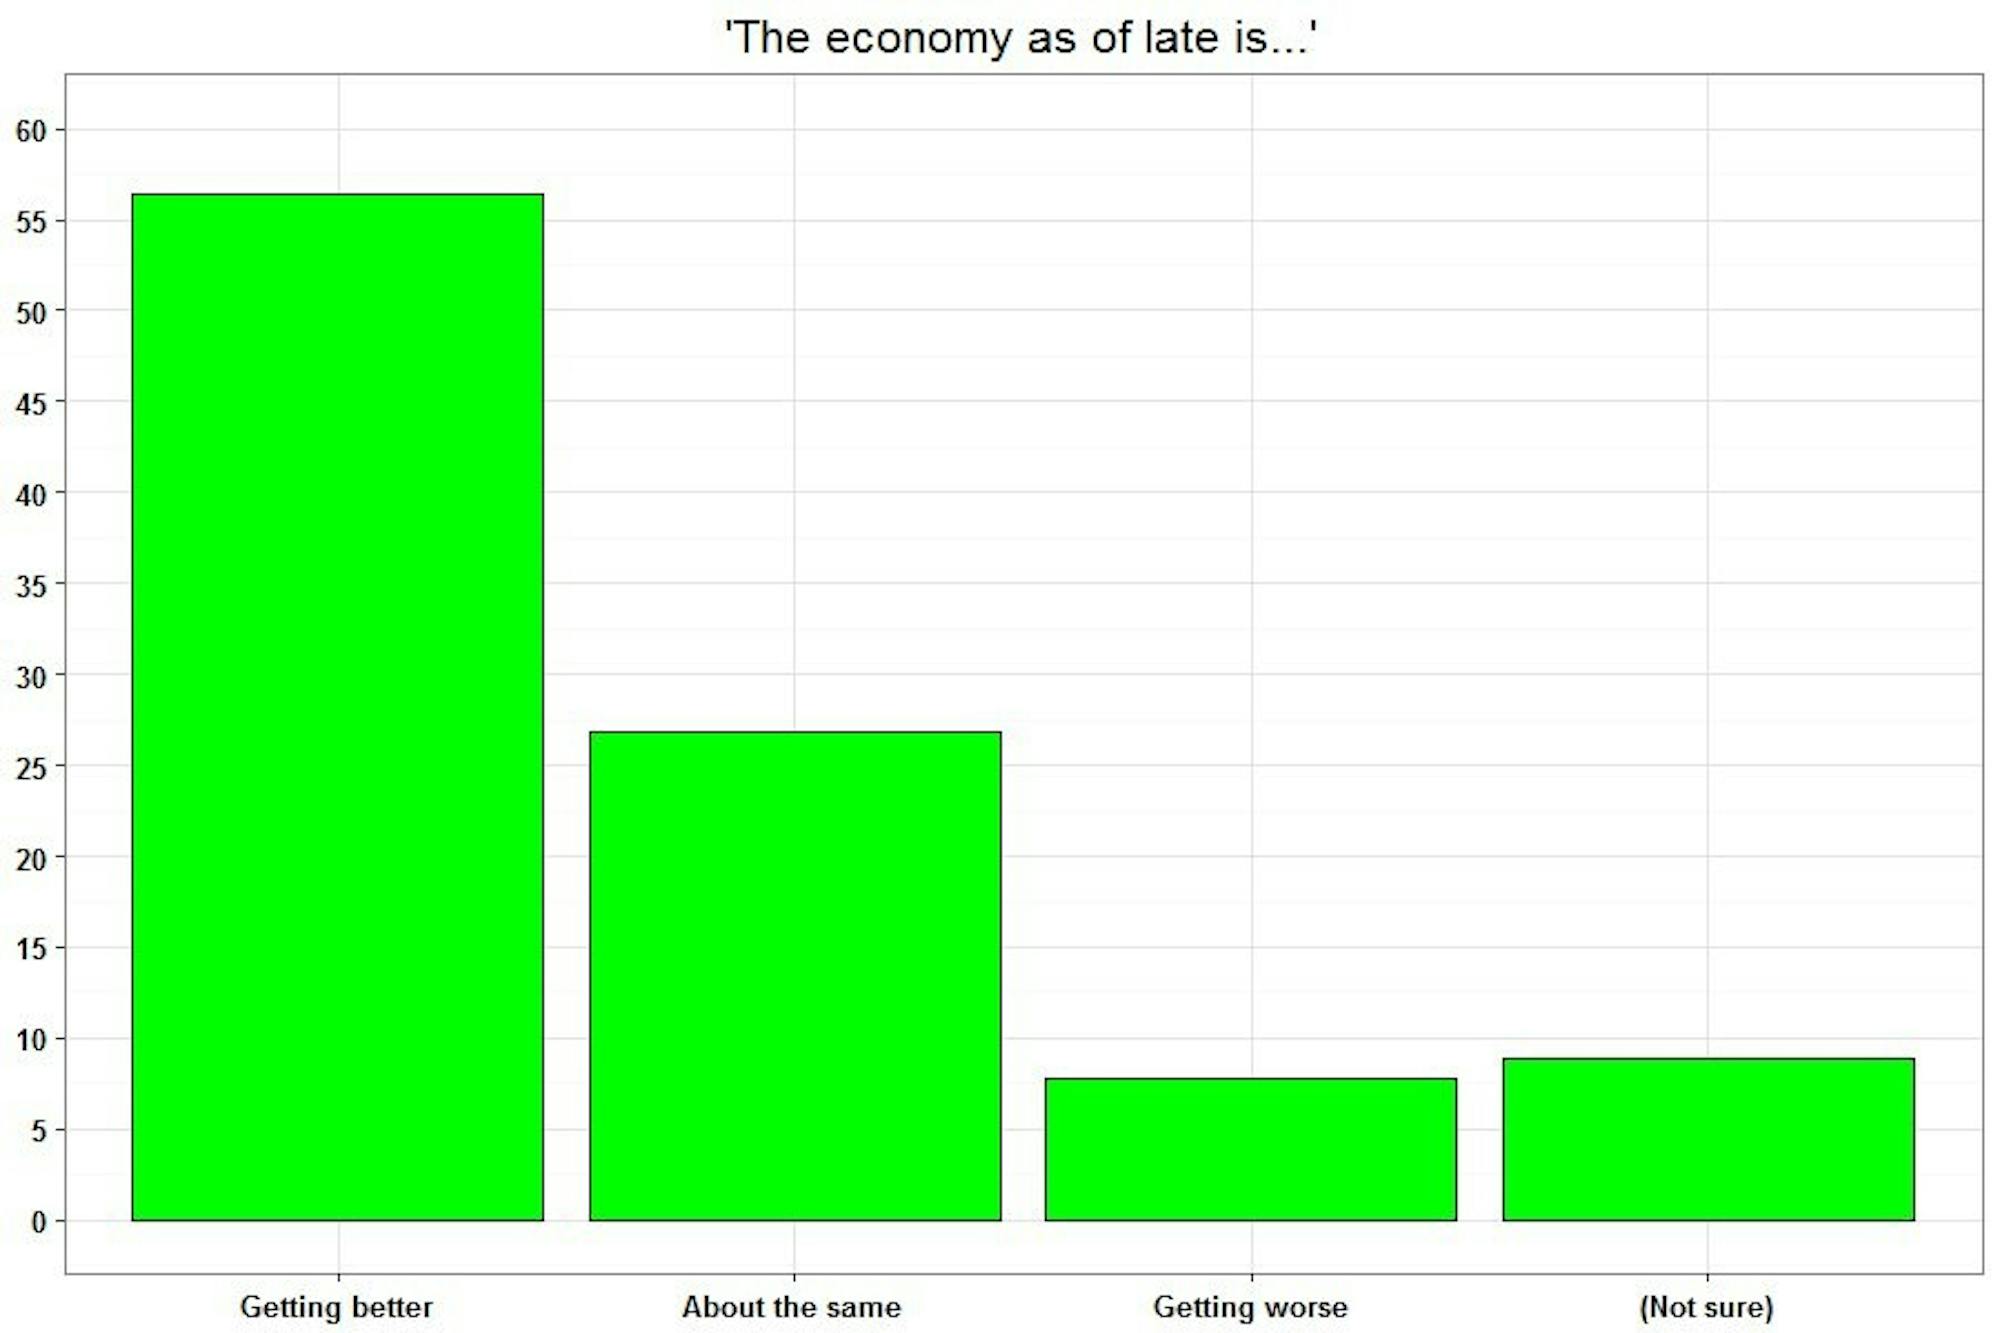
- 56.4 percent of students say the economy is getting better as of late
Vote Choice
When students were asked about their vote intention with third party candidates listed, 65.9 percent of Dartmouth students said they would vote for Democratic Party nominee Hillary Clinton. Libertarian Party nominee Gary Johnson garnered 13.6 of the intended vote, while Republican Party nominee Donald Trump managed only 6.3 percent and Green Party nominee Jill Stein received 2.8. When forced to decide in a two-way matchup between the major party nominees, 74.4 percent of respondents sided with Clinton and 10.2 with Trump.
As the presidential primary season concluded, speculation abounded as to whether rank and file voters would coalesce around their respective nominees. Among the polled Dartmouth students who voted for former Democratic candidate Bernie Sanders in the primaries, 63.4 percent said they were planning to vote for Clinton, 12.2 for Johnson, 12.2 for Stein and none for Trump. Among students who voted for former Republican candidate John Kasich in the primaries, 34.8 percent said they were voting for Clinton in the fall, 30.4 for Johnson and 21.7 for Trump.
In a parallel trend, self-identifying Republicans at Dartmouth have decidedly not fallen back on their party’s nominee. While Clinton attracted support from 90.6 of Democratic students, 42.1 percent of Republicans plan to vote for Johnson, 23.7 for Trump and 15.8 for Clinton. While Clinton pulled in a good amount of Republicans, the ideological disposition of her supporters at Dartmouth remains staunchly leftward: 87.9 percent of students planning to vote for Clinton said their ideological views are very, somewhat or slightly liberal, with only 9.5 self-identifying as moderates.
Candidate Favorability Ratings
In expressing the favorability of the presidential nominees, the upshot from these ratings was clear: Dartmouth students overwhelmingly like the Democratic nominee more than the Republican one. While Trump received a -89.1 net favorability rating, Clinton had a +18.9 one. A few noteworthy discrepancies by demographic characteristics appeared in these ratings. Students from families with household incomes north of $200,000 gave a 21.4 percentage point greater net favorability rating to Clinton than students who come from below that income group. In addition, there was a 16.2 greater net favorability rating for Clinton from students affiliated with Greek life compared to those non-affiliated.

“I’m definitely am not surprised by how unfavorable Trump is at Dartmouth,” said College Democrats president Charlotte Blatt ’18 after seeing the ratings. “I think Dartmouth students are very sensitive to things like social issues, are very sensitive to issues of race and ethnicity because we have a lot of dialogue about that on our own campus. So hearing this rhetoric is particularly offense. I think that the dialogue on our campus makes us receptive to a lot of criticism of Trump.”
Feelings about this Election
Even after divisive primary seasons like the one that occurred in the 2016 electoral cycle, voters ultimately end up voting for their party’s nominated candidate at high rates. However, that does not always mean direct support for the party’s nominee is their primary impetus behind voting. When asked about what’s motivating their vote choice, 40.1 percent of students said they’re mostly voting “against Trump,” with only 34.1 percent chose voting “for Clinton” as their primary vote motivation.
How does voter motivation vary by partisan affiliation? Among Democrats, 43.5 percent listed “against Trump” as their vote choice motivation, compared to 51.9 percent “for Clinton.” Among Independents, 50 percent said “against Trump.” For Republicans, 30.6 percent said “against Trump,” and 44.4 listed “against Clinton” as their motivation.
Altogether, 51.9 percent of students said voting against a candidate was their primary vote motivation, as opposed to 38.3 who listed voting for a candidate as their chief reason. This aspect leads into another key finding from the survey: the strong discontent expressed by students with the candidate options for president in front of them. A combined 77 percent of respondents said they were either very or somewhat dissatisfied with their vote choice options, given the nominations of Clinton and Trump. Republicans in particular — 81.6 percent — expressed dissatisfaction with their options.
Demographics
Of respondents, 44.6 were male and 55.4 percent were female. When asked about their race/ethnicity, 64.4 percent of respondents identified only as white, with the remaining 35.6 choosing black, Asian, Hispanic, Native American, multi-racial or other. Of respondents, 41.8 percent said they came from families with household incomes greater than $200,000, while 22.5 said their family income was less than $100,000. Of students surveyed, 63.9 percent said they were part of a fraternity, sorority or gender inclusive fraternity. In terms of party identification, 66.4 percent of respondents identified as Democrats or Democrat leaners, while 21.8 percent identified as Republicans or Republican leaners.
Methodology
From Wednesday, Aug. 3 to Monday, Aug. 8, The Dartmouth administered an online survey of student attitudes on issues related to U.S. politics. Focusing only on opinions of students on campus, the survey was only sent to members of the Class of 2018. One hundred and eighty of the 1,152 Class of 2018 students responded, making for a 15.6 percent response rate. Sample characteristics matched demographic distributions of administrative information and those found in past surveys well.
Dartmouth College Republicans president Michelle Knesbach ’17 did not respond to requests for comment.
Correction Appended (Nov. 28, 2017):
Methodology notes for the previous version of the Aug. 11, 2016 article “U.S. Politics Survey” stated that the survey was an “opt-in” one. Because every student in our target population is contacted to take the survey, this term is incorrect and the methodology notes have been updated accordingly.