
This article is featured in the 2021 Commencement special issue.
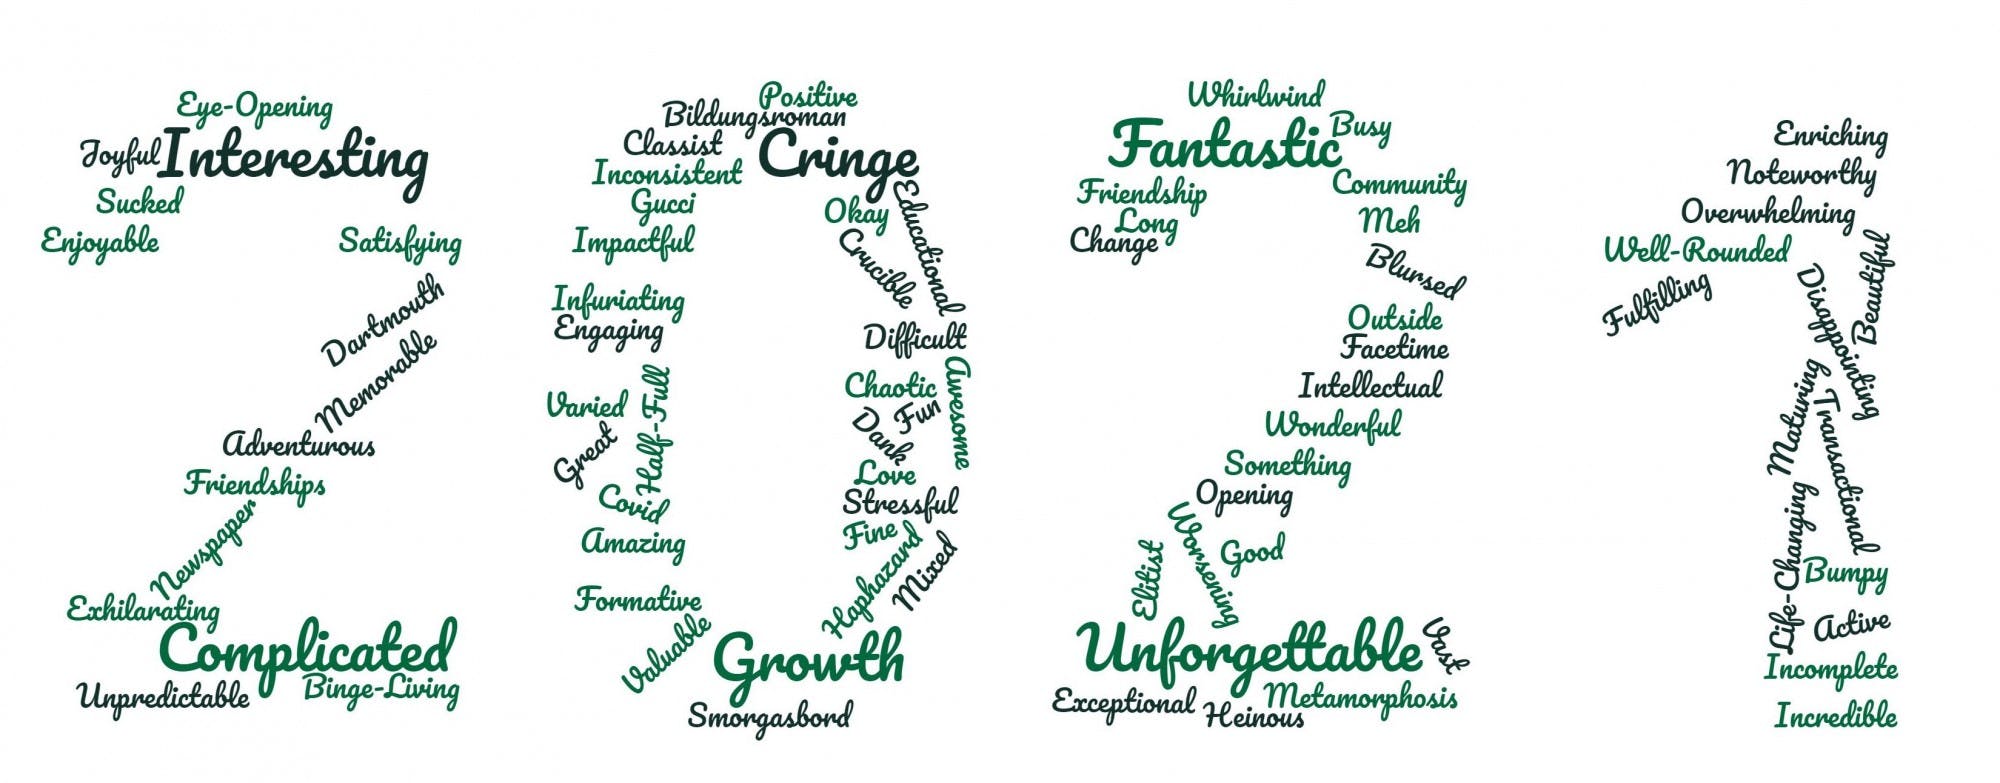
For the sixth year in a row, The Dartmouth conducted a survey recording the opinions and experiences of Dartmouth’s graduating class. Since arriving at Dartmouth in 2017, the Class of 2021 has had a Dartmouth experience that has been similar in some respects, yet radically different in others, compared to the classes that have come before. Perhaps most significantly, this year’s seniors went through an especially abnormal senior year on a campus hollowed out by the COVID-19 pandemic. Some never made the trip back to campus at all last fall, experiencing their last year at Dartmouth from afar. The following four sections canvas the Class of 2021’s views on campus issues, student life, national and local politics, and their futures.
Campus Issues
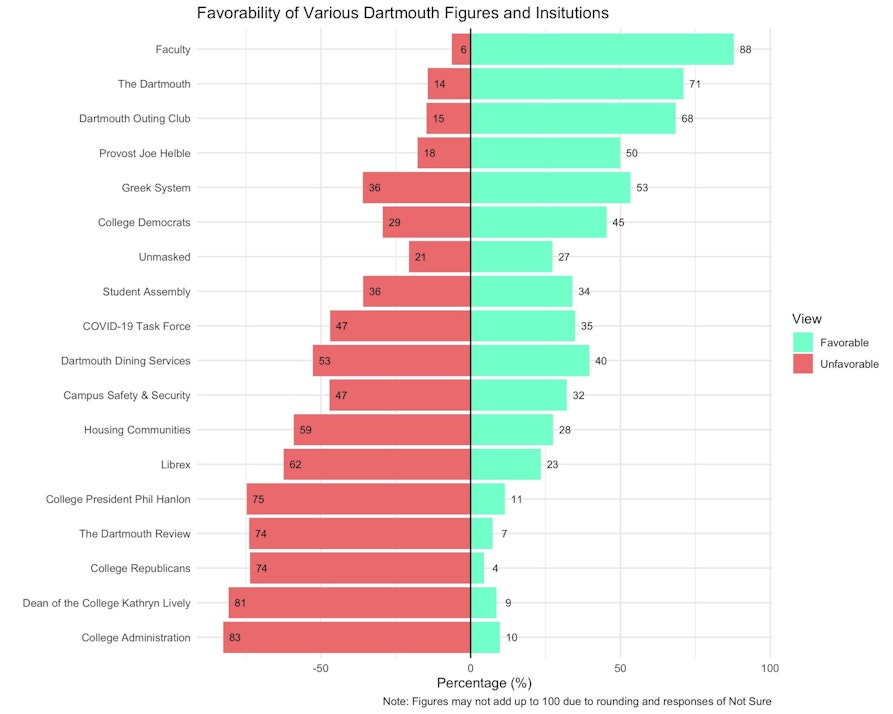
The Class of 2021 holds a significantly more negative view of the Dartmouth administration than their predecessors, potentially fueled by a divided reception of the College’s response to the COVID-19 pandemic. Nearly the entire campus administration has a net negative favorability rating from the Class of 2021 — with the notable exception of outgoing Provost and “Community Conversations” livestream host Joseph Helble, who holds a 50% approval rating.
Among the steepest plunges was that of Dean of the College Kathryn Lively, whose Class of 2020 approval rating of 39% plummeted to just 9% for the Class of 2021. Lively’s unfavorable rating, meanwhile, skyrocketed from 37% in 2020 to 81% this year. Together, this amounts to a net favorability drop of 74 percentage points. College President Phil Hanlon, too, saw his net approval drop by nearly 51 percentage points: While 33% of the Class of 2020 reported a favorable view of Hanlon last year and 46% reported an unfavorable view, just 11% of the Class of 2021 approved of Hanlon this year, while 75% disapprove. The administration at large remains massively unpopular, with 83% of the Class of 2021 registering unfavorable views while 10% hold favorable views, for a net approval rating of negative 73 points — a 45 point drop from last year.
Non-administrative Dartmouth institutions also generally remain unpopular. Dartmouth Dining dropped from a near-even approval-disapproval split among last year’s seniors to 40% approval, 53% disapproval among members of the Class of 2021. The Department of Safety and Security is also unpopular, with 32% viewing them favorably and 47% holding unfavorable views. This unpopularity is especially pronounced among those affiliated with sororities — 51% disapprove and 26% approve — while those affiliated with fraternities view Safety & Security slightly more positively than the Class of 2021 at large, 44% unfavorable to 32% favorable. This is a reversal from the Class of 2020, where fraternity-affiliated individuals viewed Safety & Security 34 net percentage points more negatively than the senior class at large. In contrast to the administration, members of the faculty have maintained an overwhelmingly favorable view among seniors, with 88% of seniors reporting a favorable approval rating and just 6% reporting an unfavorable view.
The College’s response to the COVID-19 pandemic has been unpopular among the majority of the senior class, with 59% of seniors reporting being either somewhat or extremely dissatisfied with Dartmouth’s COVID-19 policies while 41% registered either somewhat or extreme satisfaction. The College’s COVID-19 Task Force has also declined in popularity since last year, with 47% of seniors registering unfavorable views while just 35% were favorable, a decline from the previous year where seniors were more evenly split with 39% viewing the task force favorably and 36% viewing them unfavorably.
The senior class this year reported significantly more dissatisfaction with the College’s allocation of resources towards mental health. Nearly 70% of seniors identified as either somewhat or extremely dissatisfied with the College’s policies, while just 30% report satisfaction — and only 4% of seniors are extremely satisfied. This marks a steep drop from last year, when 44% of seniors reported their satisfaction. (Note: the Class of 2021 senior survey responses closed two days after students were notified of the death of Elizabeth Reimer ’24, which was later confirmed to have been a death by suicide.)
Satisfaction with the College’s sexual assault policies has also dropped, although not as significantly as satisfaction with mental health resources. The Class of 2021 reported a nearly even 50-50 split on the issue, representing a 16-point drop from the Class of 2020, 58% of whom were satisfied with the College’s resource allocation on this issue. The drop is more pronounced among male students, whose satisfaction fell from 68% satisfied and 32% dissatisfied among the Class of 2020 to 58-42, a drop in net satisfaction of nearly 20 points. In the same time frame, satisfaction among female students also dropped from 51% dissatisfied and 49% satisfied to a 57-43 split in the class of 2021, a net decline in satisfaction of 12 points.
Satisfaction with the overall Dartmouth educational experience has also dropped. Only 81% report being very or somewhat satisfied with their Dartmouth education, marking the lowest satisfaction rate since The Dartmouth began sending out the senior survey six years ago. Only 52% of the Class of 2021 considered themselves likely to donate to the College in the future, while 48% considered themselves unlikely to donate. This is a notable decline from the Class of 2020, of whom 63% considered themselves likely to donate to the College in the future.
With most Dartmouth students learning remotely over the last year, the prevalence of online forms of connection has skyrocketed. The anonymous student platform Librex registered deep unpopularity, with 62% of seniors viewing it unfavorably while just 23% registered a favorable view of the app. Seniors are similarly divided over the mental health platform Unmasked: 27% of seniors viewed the platform favorably while 21% have unfavorable views. However, a majority of respondents — 51% — were undecided, perhaps due to lack of awareness of the app.
Student Life
When asked about the importance of various aspects of the Dartmouth student experience, seniors continued to value academics most highly. Seventy-six percent described academics as very important and an additional 19% as important. Social life was a close second, with 86% responding that it was very important or important, followed by extracurricular activities at 71%, Dartmouth traditions at 60%, outdoor activities at 60%, Greek life at 59%, study abroad programs at 53% and paid employment at 52%. Somewhat less important to members of the Class of 2021 were academic research at 45%, remote learning at 44% and politics at 28%. Least important were varsity sports at 17%, house communities at 13% and affinity/religious groups at 12%.
When asked about factors that shaped their choice of major, 93% responded that academic interest was a very important factor. The second most important factor was post-graduation career, with 84% describing it as either a very or somewhat important consideration. Members of the Class of 2021 also reported considering parental/familial influence and perceived easiness in the major decision-making process; 40% and 30% of seniors, respectively, indicated that these factors had some amount of influence over their major choice, though very few — 7% and 8%, respectively — ranked them as very important.
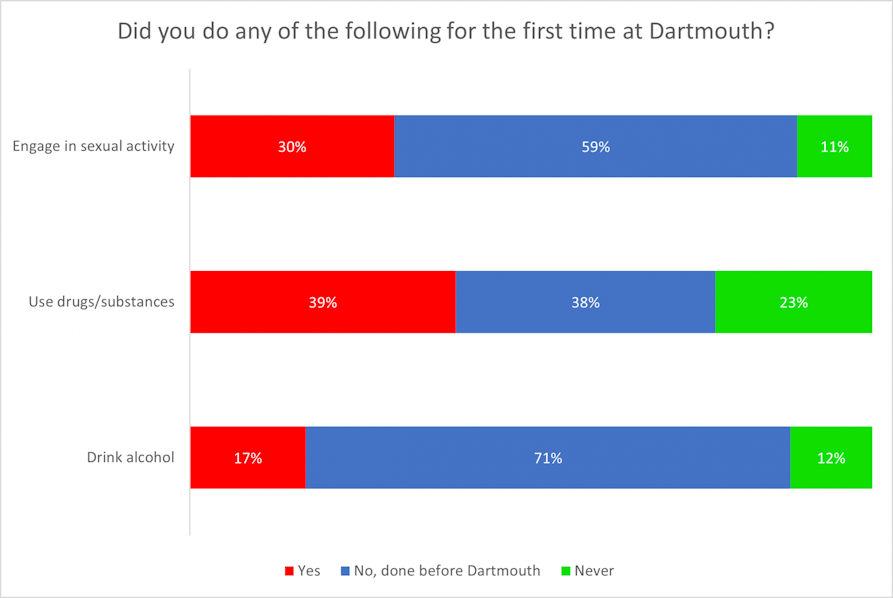
The Class of 2021 resembles the Class of 2020 in terms of romantic relationships. Thirty-seven percent report that they did not date anyone at Dartmouth. The plurality, 44%, report dating one person; 14% report dating two people; 4% report dating three people and less than 1% report dating four or more people. Unlike the previous class, only 30% of this year’s seniors report having engaged in sexual activity for the first time at Dartmouth — down from 43% last year — while 59% report having done so before Dartmouth, up from 47%; the remaining 11% report never engaging in sexual activity at all.
One Dartmouth tradition that routinely receives attention among the student body is the Dartmouth Seven, a set of seven locations on campus where students are challenged to engage in sexual activity. Despite this tradition’s notoriety, 65% of seniors say they did not complete any of the Dartmouth Seven, down from previous years — 73% and 66% for the Classes of 2020 and 2019, respectively. Among those who reported completing any of the Seven, the most popular sites apparently remain the Baker-Berry Stacks at 68% and the BEMA at 54%. The center of the Green followed at 34%. Only 30% of those who said they completed any of the Seven said they did so on the 50-yard line of Memorial Field, and only 20% reported completing Hanlon’s lawn and 10% the Top of the Hop.
As in past years, Greek-affiliated students tended to report completing any of the Seven at a higher rate than unaffiliated students, at 45% for the affiliated and only 6% for the unaffiliated. Between fraternities and sororities, 63% of those in fraternities reported completing at least one of the Seven, while only 36% of those in sororities did. One percent of the Class of 2021 claim to have completed the entire Seven; all three such respondents to our survey were affiliated: one in a fraternity, one in a sorority and one in an undergraduate society.
Regarding the consumption of alcohol, 17% of seniors reported drinking for the first time at Dartmouth, 71% reported drinking before Dartmouth and the remaining 12% reported having never drank at all. With regards to drug use, 39% of seniors reported using some drug or substance for the first time at Dartmouth, while 23% reported having never used any other drugs or substances. Among those who did use drugs while at Dartmouth, the drug of choice tended to be marijuana, with 96% reporting having used it at some point during their time at college. Other drugs had much lower usage rates among those who report using drugs: 52% report having used tobacco, 25% report having used cocaine, 24% report having used non-prescribed medications and 17% report having used LSD.
When asked to rate the importance to their Dartmouth experience of five traditional Dartmouth events — First-Year Trips, Homecoming, Winter Carnival, Green Key and sophomore summer — a solid majority of seniors ranked sophomore summer as important or very important: 77%, somewhat lower than the 82% for the Class of 2020. First-Year Trips, Green Key and Homecoming followed, at 66%, 64% and 57% respectively. As in previous years, Winter Carnival placed last, with 24% of seniors reporting that it was important or very important to them.
In their time on off-terms throughout their years at Dartmouth, members of the Class of 2021 remained busy. Many held a paid or unpaid internship — 60% and 36% respectively — while 43% traveled and 38% were employed in a non-intern/research position. More than a third took advantage of Dartmouth-sponsored internships, research, fellowships, employment or other opportunities. Lesser numbers engaged in volunteer/non-profit work or paid/unpaid research: 31% and 30%, respectively.
The Class of 2021’s senior year was severely impacted by the onset of the COVID-19 pandemic. Less than half of seniors report spending all three terms of their senior year on campus or in the Upper Valley — 49% — while 38% spent two terms, 5% spent only one and 8% remained fully remote. While the majority of seniors were on campus or in the Upper Valley this spring, 9% finished their last term at Dartmouth away from campus. At the time of the survey, most seniors planned to attend Sunday’s on-campus Commencement event, but 8% were somewhat or extremely unlikely to attend.
In terms of culinary preference, members of the Class of 2021 prefer Collis Cafe, with 39% ranking it as their favorite Dartmouth Dining Service location. The Class of 1953 Commons — Foco — and Courtyard Cafe — The Hop — are also popular, with 28% and 24% of seniors ranking these as their first choice. Less popular are Novack and Ramekin Cafe with 9% and less than 1% ranking these as their first choice.

A heat map showing the Class of 2021’s favorite places on campus. The Green, Sanborn Library, and Collis were among the top spots.
Politics
The Class of 2021’s time at Dartmouth came during a very politically charged time. Their freshman year coincided with the first year of the Trump administration, and their senior year with a months-long campaign by former President Donald Trump to overturn the results of the 2020 election that culminated in the Jan. 6 storming of the U.S. Capitol by a mob of his supporters. Political movements that this year’s seniors witnessed during their time at the College include #MeToo, demonstrations on issues like climate change, gun violence and immigration and the widespread Black Lives Matter protests following the murder of George Floyd by a Minneapolis police officer. This senior class also witnessed the intense politicization of the COVID-19 pandemic, including polarization on policies like business shutdowns, mask wearing and vaccinations.
Yet compared to the previous graduating class, this year’s seniors are somewhat more optimistic about the future, with 30% indicating that they would say things in the United States are “generally headed in the right direction,” compared to less than 10% of their predecessors — who answered the question several months after the COVID-19 pandemic began. The majority remain pessimistic, however, with a plurality of 45% indicating that things are “off on the wrong track.”
As is the case with preceding classes, a majority of the Class of 2021 hold liberal political views; 36% describe themselves as very liberal while 34% describe themselves as somewhat liberal. About 13% describe themselves as moderate, a significant drop compared to the 20% who described themselves as such in last year’s class. The number of somewhat or very conservative seniors remained fairly stable at 10% and 8% respectively.
When asked about their political views before attending Dartmouth, most seniors identified as liberal, with 59% of students identifying as either very or somewhat liberal before college while 19% of students identified as moderate and 22% of students identified as somewhat or extremely conservative. Seventy-two percent of seniors said that all or most of their closest friends share their political views, while only 21% said “some” and just 7% said few or none.
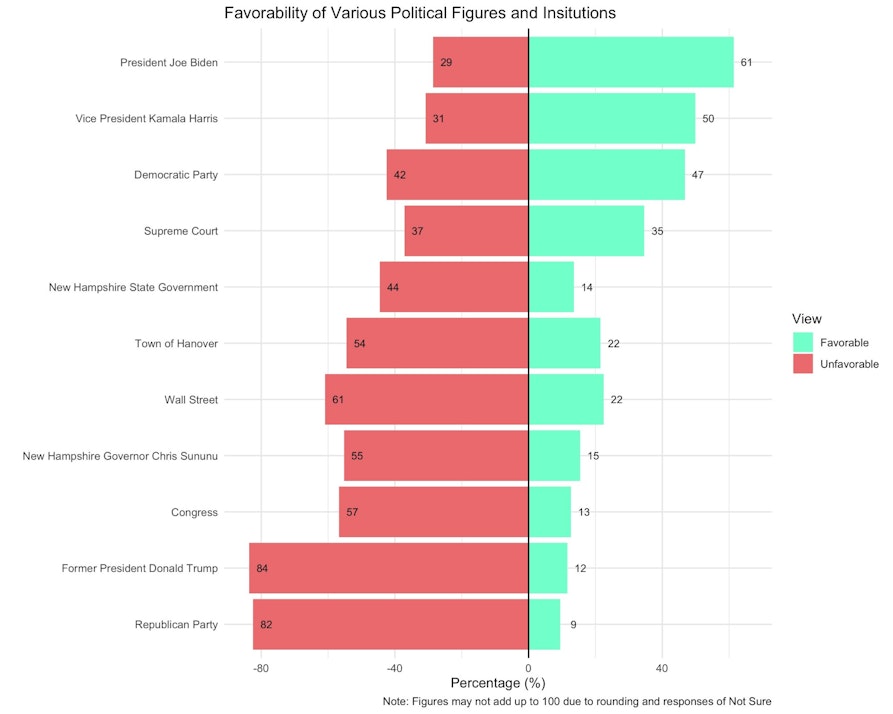
Given the majority liberal views of the student body, seniors generally viewed liberal-leaning figures and groups more positively than conservative-leaning figures and groups. A plurality of 47% held positive views of the Democratic Party, but only 9% held positive views of the Republican Party. President Joe Biden had a net positive favorability of 32% — the highest of any figure or institution asked about — with 61% viewing him favorably while 29% viewed him unfavorably. In contrast, former President Donald Trump was viewed overwhelmingly negatively; only 12% viewed him favorably while 84% viewed him unfavorably, 81% extremely so. Vice President Kamala Harris is also generally viewed favorably, with 50% favorable and 32% unfavorable views.
With regards to the other two branches of the federal government, Dartmouth students continue to have a dim view of Congress, with only 13% viewing the body favorably while 57% viewed the body unfavorably. The Supreme Court, while faring somewhat better, dropped into net unfavorability this year, with 35% viewing the high court favorably and 37% viewing it unfavorably. In contrast, 34% of last year’s seniors viewed the Supreme Court favorably while only 22% viewed it unfavorably. This drop in favorability could potentially be attributable to the change in the political composition of the Court: The late, liberal-leaning Justice Ruth Bader Ginsberg was replaced in October by conservative Justice Amy Coney Barrett in a highly contentious confirmation process.
More locally, seniors generally view the New Hampshire state government negatively, with 44% registering unfavorable views while just 14% hold favorable views. New Hampshire Governor Chris Sununu, a Republican, is similarly unpopular, with 55% viewing him negatively and 15% viewing him positively. The Town of Hanover polls at 54% unfavorable and 22% favorable.
Dartmouth students also continue to generally dislike Wall Street, with 61% disapproving while 22% approve, although this is up slightly from last year's split of 42-17 disapproval. Among the 11% of seniors planning on working in banking and finance, however, Wall Street holds a 77% favorability, with just 18% having an unfavorable view.
Post-Graduation Plans
The majority of the Class of 2021 will join the workforce following graduation, with 63% reporting that they plan to work immediately after Dartmouth. The second largest group will seek higher education: Those planning to attend graduate, medical, business and law school comprise 16%, 7%, 3% and 1% of the class, respectively. Ten percent of seniors remained undecided as to their post-graduate plans at the time of the survey. Workforce trends for the class appear similar to last year’s class, with slightly more indicating they would enter the workforce immediately, while the number planning to attend some form of graduate school remained around the same. COVID-19 has continued to have an impact on the senior class, even with rising vaccination rates: Fifty-five percent indicate that COVID-19 has had an impact on their plans, a 10% decrease from last year’s seniors.
Among the industries that the Class of 2021 will be heading for work, technology/engineering, banking/finance, and consulting remain the most popular. However, the most common field this year is technology/engineering with 28%, followed by banking/finance and consulting at 21% and 16%, respectively. Technology/engineering jobs have seen rapid growth among Dartmouth students in the past few years, doubling from the 14% of seniors who reported entering this field in 2019. In contrast, consulting jobs have been on a steady decline, from 27% of seniors in 2019 to 23% in 2020. Banking/finance roles also saw a decline of 9% compared to last year. Other popular fields among this year’s seniors are government/politics with 12% and education with 5%.
In terms of long-term career goals, the distribution across various fields becomes more even. Technology/engineering remains the most popular, with 15% of seniors wanting to work in the field 10 years from now. Academia/research, meanwhile, may see a notable increase; while just 2% are entering the field immediately post graduation, 14% want to work in it in 10 years. Other popular fields for seniors in the long-term are government/politics at 14%, banking/finance at 11%, health at 10%, and entrepreneurship/self-employment at 10%.
Geographically, most of this year’s seniors will remain in the U.S., while about 8% will move abroad, a figure similar to last year’s. Among those moving abroad, about half will stay in North America (4%), while the rest will head to Asia or Europe with about 2% for each. Within the U.S., New York and Massachusetts remain the top two states in which seniors will land at 34% and 11% respectively. Other popular jurisdictions include Washington, D.C. at 10%, California at 9%, and New Jersey at 5%. Only 2% and 1% plan to remain in New Hampshire or Vermont, respectively. However, a higher 13% plan to remain in the Upper Valley after graduation in the short-term, most for employment or graduate/medical school — 4% each. Some seniors will also stay to finish courses required for their degree — 2% — or spend more time with their classmates — 3%.
Less than a third of this year’s seniors anticipate graduating with debt, and 68% anticipate graduating with none at all. Among those graduating with debt, 31% anticipate graduating with less than $10,000 and 38% with between $10,000 and $19,999. Sixteen percent anticipate graduating with more than $40,000 in debt. Forty-three percent of seniors expect to receive some financial assistance from their parents after they graduate, somewhat more than last year’s 38% but comparable to the 44% who reported the same in 2019.
In terms of anticipated annual starting salaries, 23% of this year’s seniors entering the workforce expect to make more than $100,000 annually and another third expect to make between $75,000-$100,000. Fourteen percent expect to make between $50,000-$75,000 and 29% expect to make below $50,000. This distribution appears significantly higher than the average salary for college graduates, which is about $50,000, according to a recent National Association of Colleges and Employers salary survey.
It appears that the Class of 2021’s high starting salaries may be driven by the industries they choose to work in. For those going into technology/engineering, 43% reported having annual starting salaries of greater than $100,000. Similarly, 31% of those entering jobs in banking/finance or consulting reported starting salaries of over $100,000. No seniors going into banking/finance reported starting salaries below $75,000 and none going into consulting reported starting salaries below $50,000.
In other fields, the starting salary appears to be much lower. Eighty-one percent of seniors going into government/politics reported starting salaries below $50,000, as did half of those going into education, 95% going into public service/non-profit work, and, sadly for some soon-to-be alumni of The Dartmouth, all going into publishing/media.
Methodology Notes:
From Thursday, May 6 to Sunday, May 23, The Dartmouth fielded an online survey of Dartmouth senior students on their opinions and experiences at the school. The survey was sent out to 1,204 seniors through their school email addresses. 167 responses were recorded, resulting in a 13.9% response rate. Using administrative data from the College’s Office of Institutional Research, responses were weighted by gender, race/ethnicity, sexual orientation, Greek affiliation and international student status. Weighting was done through iterative post-stratification (raking). Survey results have a margin of error +/- 7.0 percentage points.


