From Friday, May 27 to Wednesday, June 1, The Dartmouth conducted an online survey on the demographics, Dartmouth experiences, opinions and post-graduation plans of the Class of 2016. Two hundred ninety-seven students responded, making for a 27.7 percent response rate. What follows are some of the more interesting results that the survey returned.
Demographics
In terms of the gender makeup of the Class of 2016, 59.2 percent of respondents identified as female, 40.5 as male and 0.3 as other. As for the racial breakdown, 67 percent of seniors identified as white, 7.1 as black, 2.4 as Native American/Alaskan Native, 20.5 as Asian, 7.7 as Hispanic, 5.7 percent as multi-racial and 2 percent as other. In terms of sexual orientation, 89.1 percent identified as heterosexual, 6.5 percent as gay/lesbian, 3.1 as bisexual and 1.3 as other.
As should be expected, comparing the distributions of the family household income of Dartmouth seniors and that of the United States population yields a clear picture: students at Dartmouth come from much wealthier homes. For example, while only 5.6 percent of all Americans have a household income of over $200,000, 39.7 of Dartmouth students do so, the largest amount for any of the five income brackets.
Life at Dartmouth
50 percent of seniors said their major/one of their majors was in the social sciences, the most popular field. The next most common major was in the arts or humanities (25.2), followed by math/computer science/engineering (23.8), and the natural/physical sciences (15.6). In terms of academic achievement, Dartmouth seniors reported fairly high grade-point averages. A plurality at 35.9 percent said their GPAs fell in the 3.60 to 3.79 range, while 21.5 percent had GPAs in the 3.40 to 3.59 range and 21.1 percent in the top 3.80 to 4.00 bracket.
As for non-academic life at Dartmouth, the Class of 2016 was highly involved in Greek life and various forms of athletic activities. 68.4 percent of seniors said they were affiliated with either a fraternity, sorority or gender-inclusive fraternity. Only 36.4 percent of seniors said they had not participated in athletics at any level while at Dartmouth. 21.4 percent were part of an athletics team at the varsity level, 25.5 percent at the club level and 12 percent at the intramural level.
Dartmouth traditions
As popular and widely discussed as the Dartmouth Seven are, a majority — 55.3 percent — of seniors said they didn’t complete any of the seven during their time in Hanover. As for those who did do some of them, the Dartmouth Seven with the highest completion rate was the Baker-Berry Library Stacks, with 36 percent of seniors completing it. The next most common Dartmouth Seven completed was the BEMA, at a 27.6 percent rate. With only 9.6 percent of seniors completing it, the center of the Green saw the lowest completion rate. Only 3.1 percent of seniors reported that they completed all of the Dartmouth Seven.
Out of the few popular challenges as part of Dartmouth traditions, the Lou’s Challenge was the most completed one, with 66.3 percent of seniors doing it. The Ledyard Challenge came next with a 31.3 percent completion rate among seniors, while only 11.4 percent completed the Dartmouth Decade. 23.2 percent of Class of 2016 members said they didn’t complete any of the challenges.
In the survey, seniors were asked to rank five different Dartmouth experiences — Homecoming, Winter Carnival, Green Key, sophomore summer and Dartmouth Outing Club First-Year Trips—on a scale of one to five from most important to least important. Nearly a majority of seniors at 43.8 percent chose sophomore summer as the most important experience out of the five to them, followed by First-Year Trips, Green Key, Homecoming and Winter Carnival as first choices. Out of these five traditions of Dartmouth life, seniors rated Winter Carnival as the least important to them.
Among the several habits the survey asked about, 41.4 percent of seniors said they drank alcohol more than once a week and 35 percent said they drank at most once a week. Only 7.9 percent said they never engaged in drinking during college. Far fewer seniors reported that they used drugs/substances as often, with only 7.5 percent using them more than once a week. 54.9 percent said they never used drugs while at Dartmouth. Sexual activity was a lot more frequent, with 30.5 having sex more than once a week and 67.3 percent saying they did so at least once per month. 21.2 percent of seniors said they have not had sex while at Dartmouth.
Affording Dartmouth
The issue of student loan debt after completing college has worsened considerably in the last decades. Though different from the experiences of most U.S. college students, Dartmouth seniors face similar difficulties of debt after leaving Hanover. 30.6 percent of them reported that they took our private or federal loans under their names while at Dartmouth. Out of those who gave a specific loan dollar amount for their debt, seniors owe a combined amount was $1,723,664 in debt. Out of the Dartmouth seniors who said they took out federal loans, they owe an average of $23,940. 10.5 percent of seniors also said their parents took out loans under their names, and out of those who provided a loan dollar amount, parents of seniors owe an average of $33,448.7 in debt. That aid all came in addition to financial aid directly from the College — exactly 50 percent of the sample of surveyed seniors said they ever received financial aid while at Dartmouth.
These financial difficulties also had a strong racial component to them. Of the seniors who said that they had at one point received financial aid while at Dartmouth, non-whites made up 58.5 percent of this group. Of those who had never received financial aid, 78.2 percent were white. Similarly when asked whether they took out private or federal loans while at Dartmouth, a majority of seniors — 53.7 percent — who took out loans were non-white, while 67.2 of seniors who did not take out loans were white.
Satisfaction at Dartmouth
Looking back at their time at Dartmouth, seniors were generally satisfied with different aspects of their experience at the school. 94.5 percent said they were very or somewhat satisfied with their education at Dartmouth, while less than four percent expressed a negative experience with their education at the school. In terms of volunteer and internship opportunities, seniors were similarly positive, with 81.1 percent reporting very or somewhat satisfaction with these type of opportunities and experiences they had while at Dartmouth. Off terms opportunities brought just as much of a positive experience for seniors, 83.3 percent of which said they came away satisfied with how off terms went for them.
Class of 2016 Opinion
American political scene
The Class of 2016 leaned heavily leftward politically, as 69 percent of seniors were Democrats while only 18 percent Republicans. Seniors were similarly distributed along the measure of political ideology — 65.7 percent identified as either very or somewhat liberal, and only 18.2 percent described themselves as moderate. Interestingly, seniors affiliated with Greek organizations were nearly 14 percentage points more likely to identify as Democrats.
Accordingly, for the current presidential race, seniors have much more favorable views of the Democratic candidates than the one Republican candidate left. The Class of 2016 had very similar views of Hillary Clinton and Bernie Sanders, though they favored Sanders slightly more. Clinton had a 23.2 net favorability and Sanders had a 24.2 net favorability. However, seniors were much more polarized about the Vermont senator. On a five-point scale of very or somewhat, favorable or unfavorable, and none of those options, seniors rated Sanders about 4 percentage points more “very favorable” but also 5 percentage points more “very unfavorable” than they did for Clinton, who fell more in the middle (using “somewhat” more than “very” to describe feelings toward her).
On the other end of the spectrum, Republican nominee Donald Trump is decisively disliked by the Class of 2016. Only 3.1 percent of seniors had a favorable view of him, while 93.2 rated him unfavorably.
That’s in line with how seniors plan to vote in the upcoming November general election: 66.1 percent said they’ll vote for Clinton and 3.4 percent for Trump, while 7.9 percent they will not vote, and 12.7 said they don’t know yet. Though there were few of them in the sample, 44.4 percent of seniors who identified as Republicans said they would vote for Clinton in the fall.
There also appears to be somewhat of a Greek/non-Greek divide in views toward the two current Democratic presidential candidates. While 59.5 percent of seniors apart of the Greek system expressed a favorable view of Clinton, only 45.2 percent non-affiliated students did the same. As for the other Democrat in the race, 61.3 percent of seniors not affiliated with a Greek house had a favorable view of Sanders, but fewer affiliated seniors had as favorable a view at 54 percent.
Dartmouth-related opinions
The survey also asked seniors about their opinions on several matters that garnered plenty of attention during their time in Hanover. The most popular issue asked about on the survey was the Divest Dartmouth, with 45.8 percent of seniors having a favorable view of the movement. The next most favorable issues were sexual assault policy changes (39.7 percent) and the Black Lives Matter movement on campus (34.7 percent). On most issues, seniors had much more negative views. 77.1 percent of them had an unfavorable view of the administration as a whole, 61.5 percent had an unfavorable view of The Dartmouth Review publication, and 60.3 percent had an unfavorable view of the job College President Phil Hanlon has done.
43.3 percent of Democrats had a favorable view of the Black Lives Matter movement on campus, while 31.6 had an unfavorable view of it. Though the survey attracted a much smaller sample for this partisan group, among Republican students, none of them had a favorable view of Black Lives Matter, while 82 percent had an unfavorable view (the rest were apathetic). Despite the small sample of Republicans who responded to this favorability question regarding Black Lives Matter (50 people). This split mirrors the Democrat/Republican division in favorability towards BLM found in the general American public.
Some other partisan divides materialized as well. Seniors who identified as Democrats had a -39 net favorability toward Hanlon, while Republicans had a -56 net score towards the Dartmouth president. While Democrats had a -28 net favorability of changes to Greek life on campus, Republicans had a -80 net favorability towards this aspect of Dartmouth life that has attracted plenty of controversy in the last few years.
Expectedly, affiliated seniors were almost 40 percentage points more likely to have an unfavorable view of changes to the Greek system than non-affiliated seniors were. Those part of the Greek system were also about 17 points more likely to have an unfavorable view of the job Hanlon has done, and 30 percentage points more likely to unfavorably view the administration as a whole. The other sizable discrepancy regarding the surveyed Dartmouth-related issues occurred for Divest Dartmouth: seniors affiliated with the Greek system had about an 11-point more unfavorable view of the movement than non-affiliated seniors did.
Post-Graduation Plans
61.7 percent of seniors planned on entering the workforce as part of their post-graduation plans. 14.8 said they would start graduate school, 8.3 said they would take a gap year after graduation, and 8 percent said they still were not sure what their plans are.
New York was the most popular post-graduation destination, with 25 percent of seniors going there. Massachusetts and California follow behind the Empire State, with 15.6 and 14.8 percent, respectively, of seniors going to these states. 8.2 percent of members of the Class of 2016 will be living outside the United States next year, in addition to 7 percent staying in New Hampshire and 6.3 percent moving to Washington D.C.
In the graph of post-grad senior salary by occupation, going from the bottom to the top of each bar corresponds with increasing salary. The purple and light blue sections represent the highest salary brackets. Results from the survey show that seniors going into technology/engineering after graduation will have one of the highest salaries next year, with 33.3 percent of that group earning over $100,000. Seniors entering finance and consulting jobs will earn the next most. These three occupations also are the most common workforce destinations for senior, with consulting the highest at 16.7 percent.
Note: some of these subgroups — namely the four rightmost bars — suffer from small sample size, making it difficult to make strong conclusions about these groups.
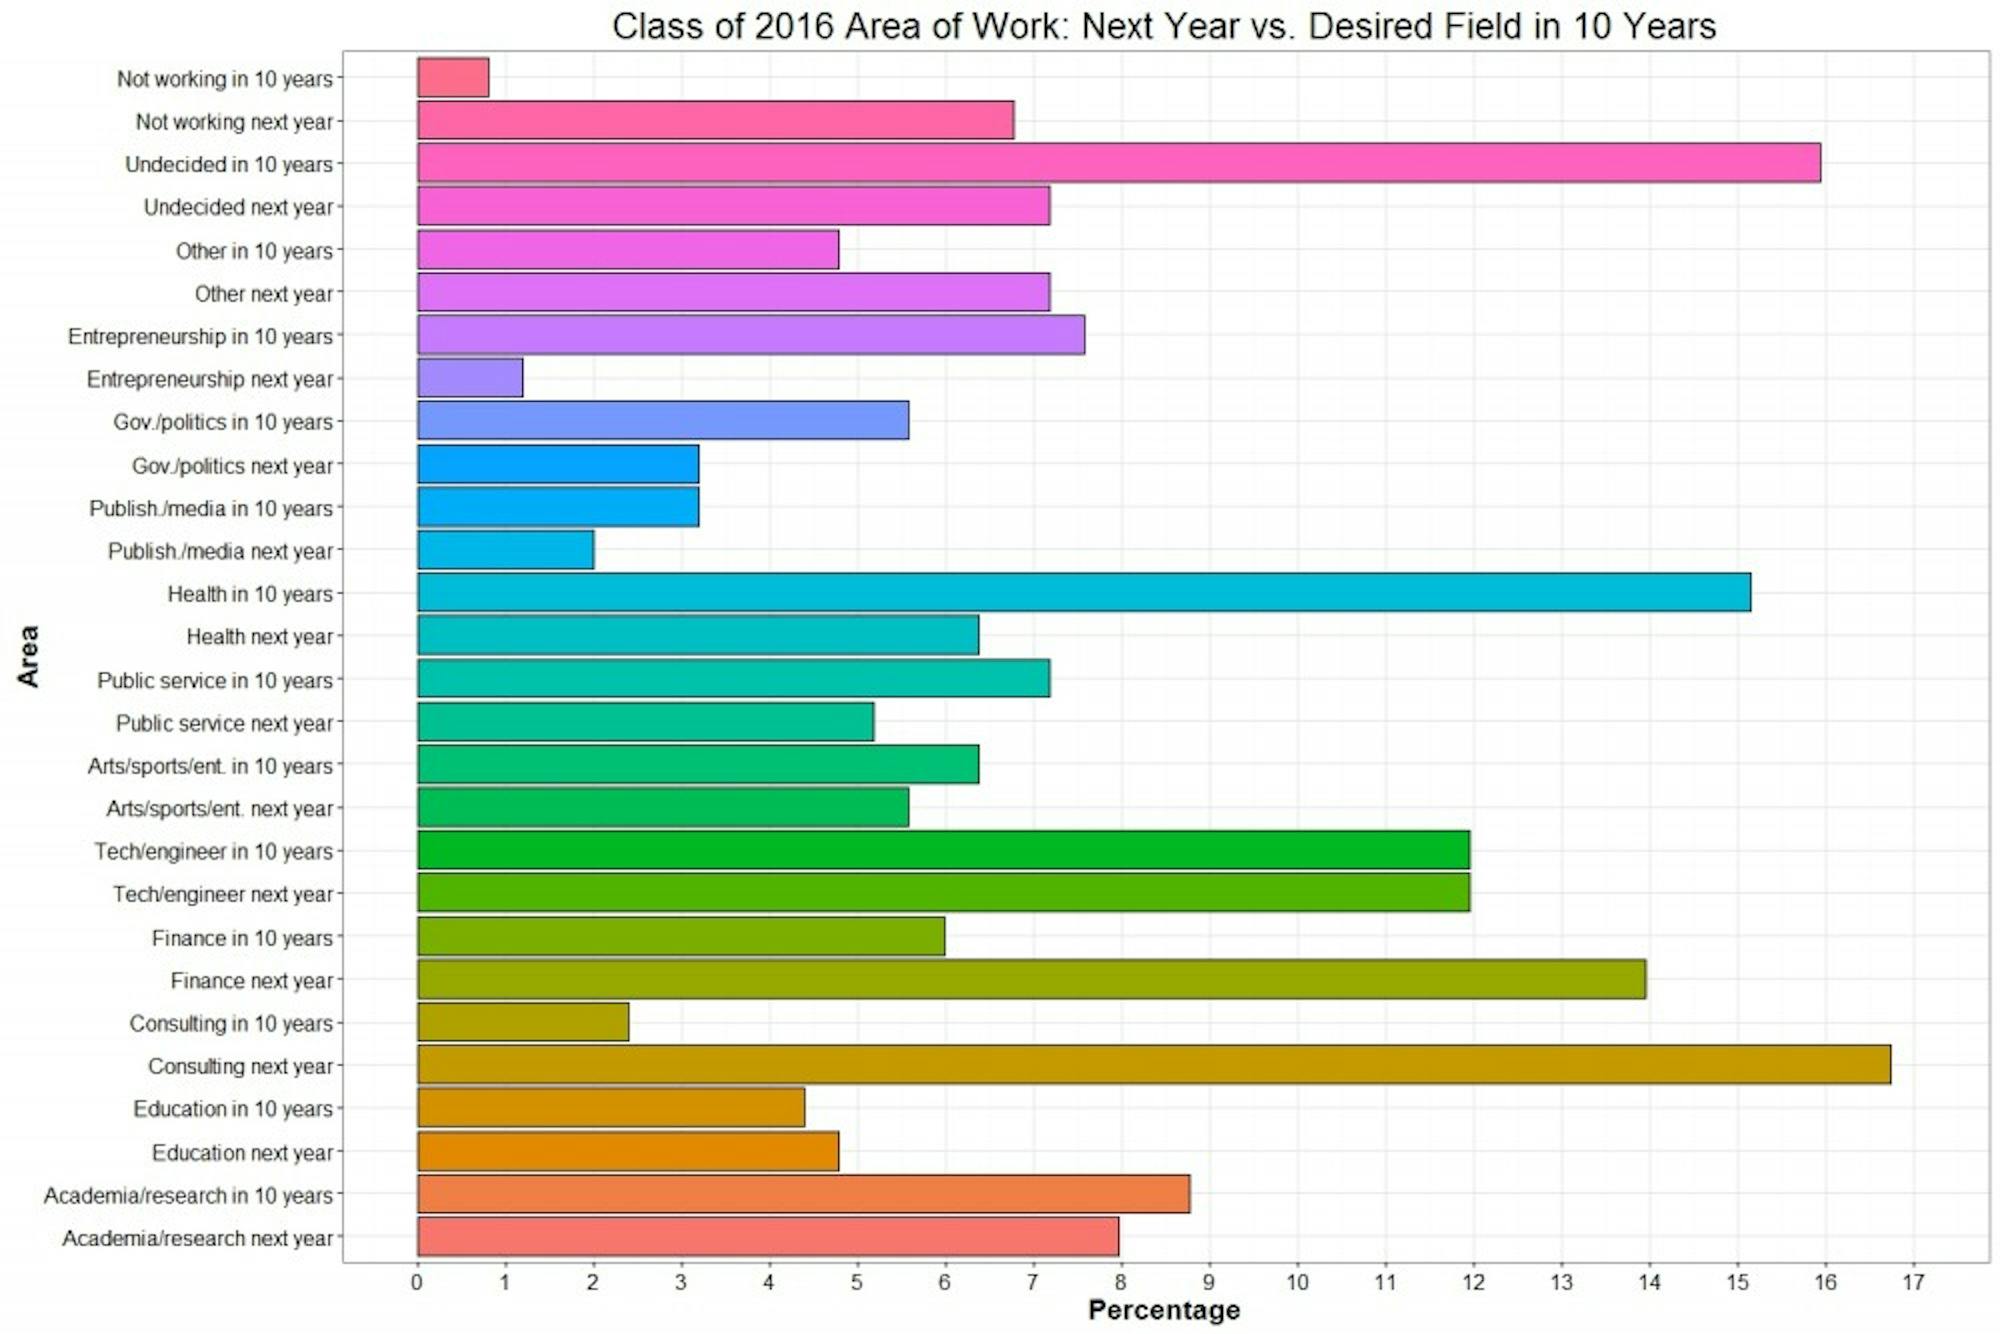
Several differences appear between what fields seniors will enter following graduation, and what fields they want to pursue in 10 years. The largest discrepancies occur for consulting and finance, two of the most popular areas of work for seniors: more than half in each do not want to continue in that area of work in 10 years. On the other end, many more people want to be in health, entrepreneurship and government/politics 10 years from now.
Correction Appended (Nov. 28, 2017):
Methodology notes for the previous version of the June 14, 2016 article “Class of 2016 Senior Survey” stated that the survey was an “opt-in” one. Because every student in our target population is contacted to take the survey, this term is incorrect and the methodology notes have been updated accordingly.