With the presidential election just one week away, a recent survey conducted by The Dartmouth found that students overwhelmingly support Democratic nominee Hillary Clinton. Despite this near unanimity, dissatisfaction and pessimism regarding the election pervades student opinion. The survey also found a sharp split among Republicans, with Clinton, Republican nominee Donald Trump and Libertarian Party nominee Gary Johnson each pulling 25 percent from this group’s support.
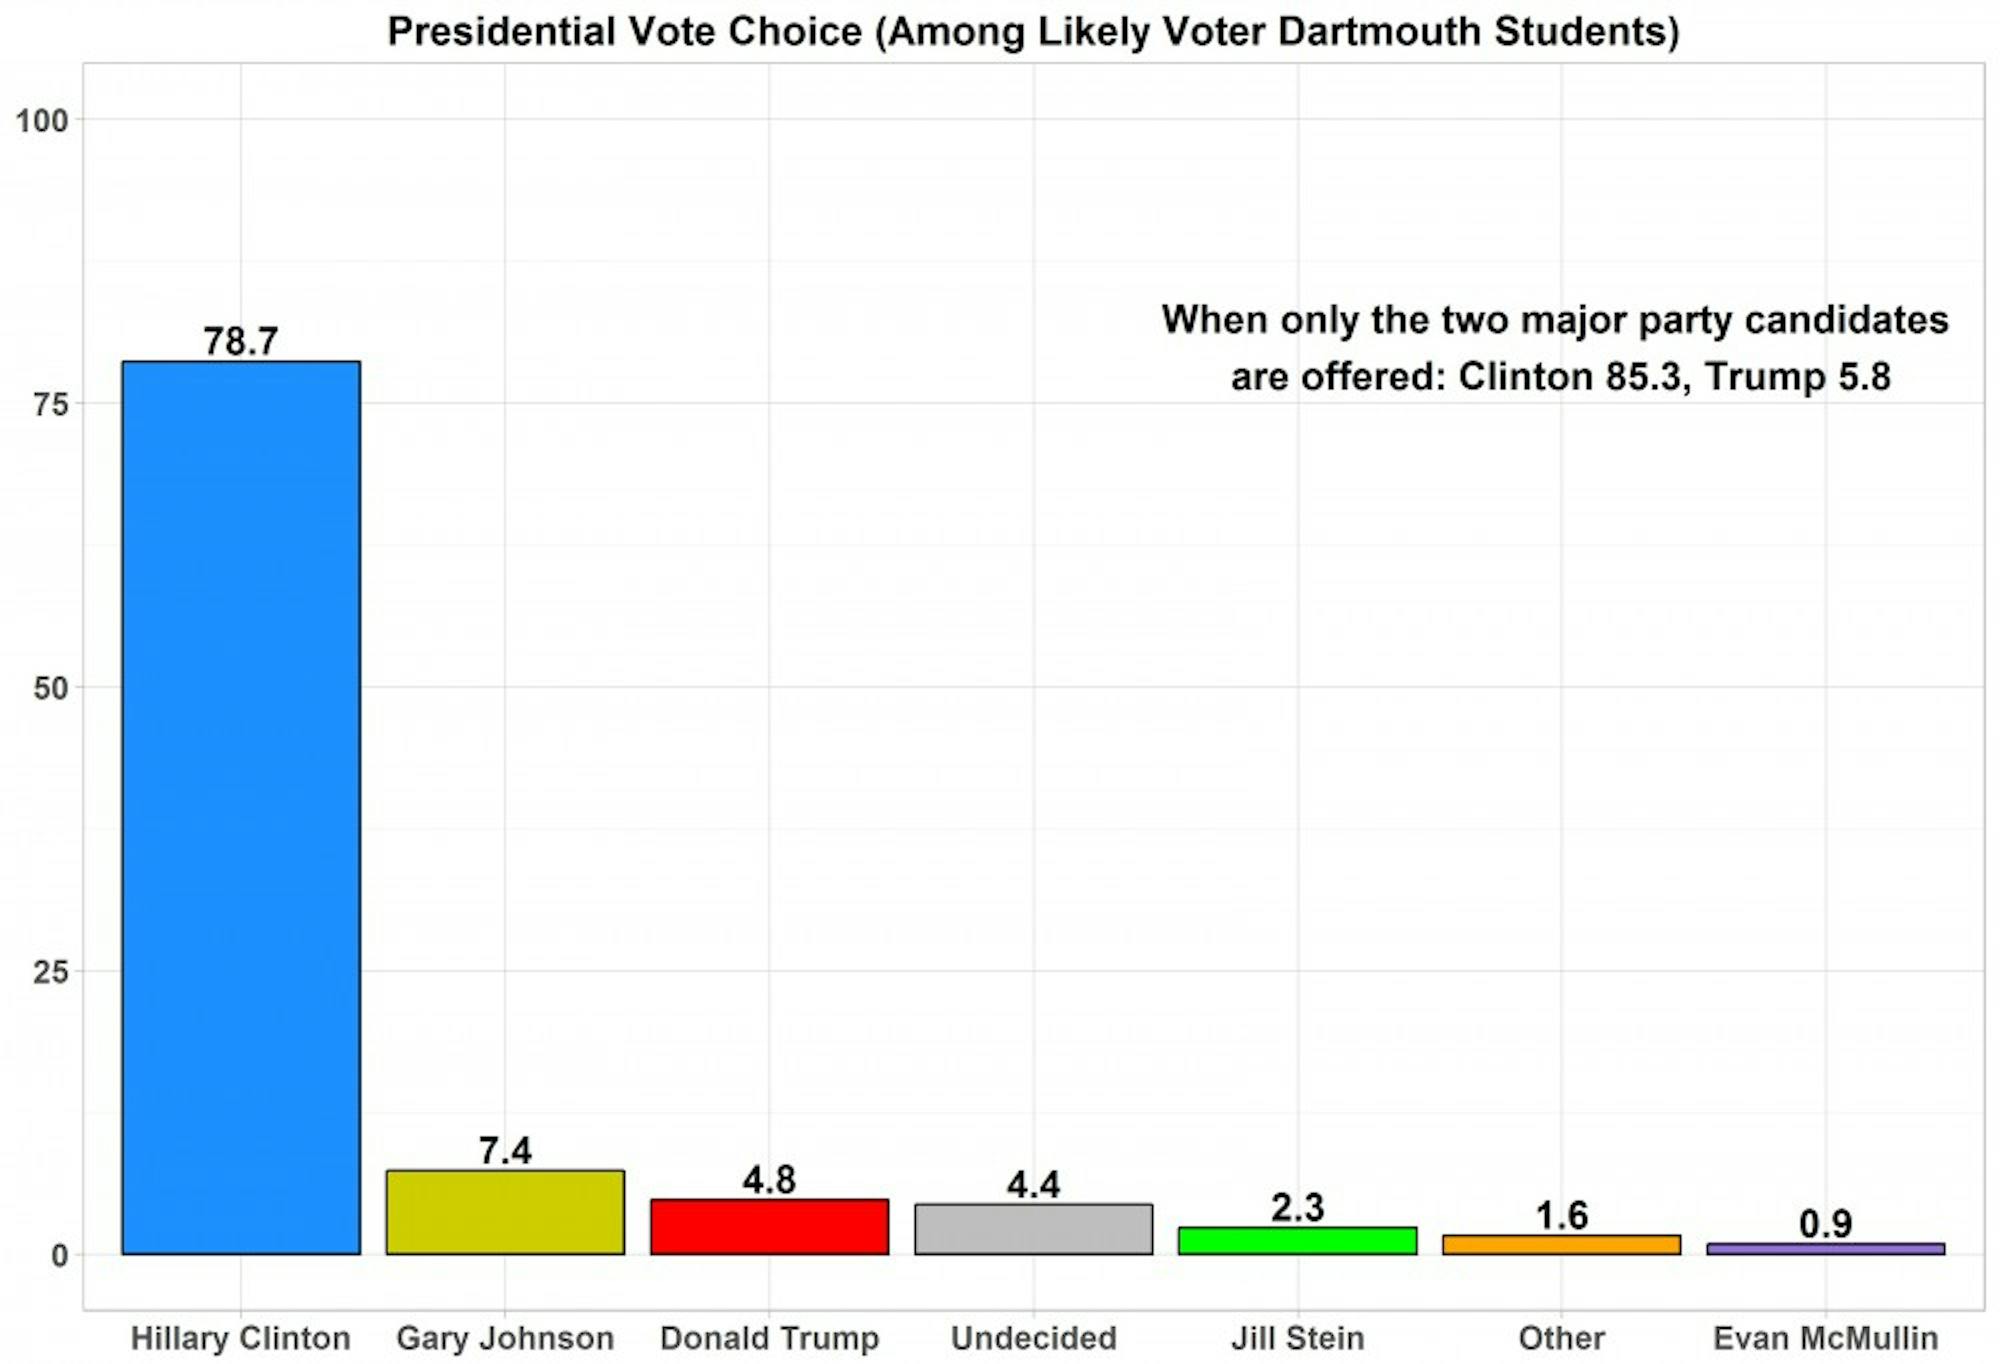
When offered to choose from five different candidate options, 76 percent of voter-eligible students said they would vote for Clinton. Johnson came in second with 8 percent, Trump in third with 5 percent, while 5 percent of students remain undecided. When given only the two major party nominees as candidate options, Clinton’s lead grew to 83 percent and Trump’s to only 6.
A likely voter screen increased Clinton’s support in both vote choice questions. Once narrowed down to students who said they were “very likely” or “somewhat likely” to vote in the general election — which 81 percent of the student body chose — Clinton’s lead in the five-way question jumped three percentage points to 79 percent, and two points in the two-way question to 85 percent. Non-major party support tends to fade the closer we are to Election Day, and thus the 85 percent mark for Clinton — among likely voters in the two-way question — provides the clearest picture of student vote intention at the moment.
The likely voter screen peeled support away from other candidates. Even then, when choosing between several candidates, third party candidate Johnson receives greater support at 7 percent than Trump does at 5 percent.
The vote choice results represent marked increases of support for Clinton among students. In a survey of members of the Class of 2018 in August — who are representative of the student body — Clinton received 67 percent of support from likely voters when all candidate options were given, and 76 percent when only Clinton and Trump were candidate options. With the caveat of small question wording differences between surveys, Clinton appears to have consolidated Dartmouth student body support over the last few months.
The closest national comparison one can draw is with vote intention numbers from 18-29 year old likely voters. A Politico/Morning Consult tracking poll in late October found that among these young voters, 56 percent opted for Clinton and 31 percent for Trump. While it presents the largest disparity by age at the national level, Clinton’s advantage here pales in comparison to hers among Dartmouth students, who skew much more liberal and come from much higher socioeconomic backgrounds.
This latter quality may explain why Trump receives relatively little support from even his own party’s rank-and-file voters on campus. Among likely voters who self-identify as Republicans, 26 percent support Trump, 25 percent plan to vote for Clinton and 24 percent back Johnson. Without third party candidates listed, Trump sits at 32 percent and Clinton at 29 among Republicans. This stands in great contrast to the other major party’s internal dynamics. Among likely voters who self-identify as Democrats, Clinton received 92 percent of support in the five-way option and 99 percent in the two-way option.
Feelings about the election
Among likely voters, Dartmouth students as a whole are slightly more inclined to vote “against” Trump (44 percent) than “for” Clinton (42 percent). A similarly small difference holds when comparing the vote choice motivation of only Hillary Clinton supporters. In the two-way question among likely voters, 49 percent of Clinton supporters said they were voting “for” Clinton, while 50 percent said they were voting “against” Trump. When only looking at Democrats on campus, the motivation takes a more affirmative tone — 53 percent for their candidate and 45 percent against the opposite one.
For a national level comparison, a recent ABC News poll found that 56 percent of Clinton voters mainly supported Clinton, while 42 percent mainly opposed Trump. In other words, Clinton supporters across the entire United States support their candidate much more in the affirmative than Dartmouth ones do.
Students also showed great signs of dissatisfaction with the candidate options in the election. A plurality at 36 percent said they were very unsatisfied with their choices, and in total, 68 percent of likely voter students said they were very or somewhat unsatisfied with the candidate options.
Interestingly, among likely voters who support Clinton, 65 percent said they were unsatisfied with the field of candidates compared to 25 percent who were satisfied. Out of all three partisanship groups, Democrats were most satisfied with their options, as only 62 percent said they were unsatisfied, compared to 81 percent of independents and 89 percent of Republicans.
In describing the emotions that this election has engendered, students expressed overwhelmingly negative feelings. Feeling “frustrated” was most common among students at 69 percent, and 60 percent of students said they felt “disgusted” and 50 percent “scared.” These answers heavily outweighed more hopeful outlooks: only 8 percent felt “optimistic” and 9 percent felt “excited.” Even interest in the election came in at low levels, with only 27 percent saying they were “interested.”
Compared to the entire country, Dartmouth students expressed a more pessimistic outlook on the election on all counts of these feelings. A Pew Research Center survey from earlier this fall found 57 percent of registered voters saying they were frustrated, 55 percent disgusted, 43 percent scared, 31 percent interested, 15 percent optimistic and 10 percent excited.
Candidate perceptions
Throughout the primary and now the general election season, both major party candidates have been criticized for their ideological orientations. Liberals have decried Clinton as being too moderate, while conservatives pointed to her being too liberal to gain their vote. Those on the left have condemned Trump’s apparent right-wing extremism, while many on the right question Trump’s ideological consistency.
Among likely voters, 59 percent of Dartmouth students categorize Clinton as “somewhat liberal,” 29 percent see her as “moderate,” and only 10 percent as “very liberal.” This perceived ideology mirrors the distribution among Democrat students well — for example, 63 percent of Democrats see her as “somewhat liberal” and 32 percent as moderate — but among Republicans, Clinton gets classified as “somewhat liberal” 46 percent of the time and “very liberal” 38 percent.
Perceptions become much more extreme when evaluating Trump, however. Among likely voters, 45 percent of students see him as “very conservative” and 44 percent as “somewhat conservative.” Interestingly, fewer self-identifying Republican students — 24 percent — view him as “very conservative.”
It’s nevertheless clear that Dartmouth students view Trump as staunchly conservative. At the same time, it’s worth noting that this perception may not be as clear-cut in light of certain political science research. This line of research came to term Trump as an “ideological moderate,” not because he’s moderate on individual issues, but because his extremism on various issues averages out to moderation. For example, in the context of GOP politics, while very conservative on immigration, Trump is relatively more liberal on government spending. In other words, the mixed bag and inconsistent nature of his support doesn’t make Trump moderate by any means, but puts him far out of step from conservative orthodoxy — and thus less solidly conservative.
Finally, Dartmouth students responding to the survey were asked whether they think Trump’s influence on American politics — the voter base he’s attracted and the ways in which he’s redefined the Republican Party — will continue past this election cycle. Among all respondents, 61 percent agreed that his effect would continue, 25 percent were not sure, and 14 percent disagreed with this notion. While self-identifying Democrats and Independents were in line with these average perceptions, Republicans were more likely to believe their party and the political system would shed itself of Trump – 51 percent said Trump’s influence would last, while 29 percent said it would not.
Methodology
From Oct. 25 to Oct. 31, The Dartmouth administered an online survey of Dartmouth student attitudes on the 2016 Election through Pulse, an online survey platform designed to collect and share student public opinion. The survey was sent out to 4,602 students and 517, or 11.2 percent, responded. Results were weighted to match the demographic makeup of the Dartmouth student body by gender and graduating class year according to Office of Institutional Research data. The survey results have a margin of error of +/- 4.4.
Correction Appended (Nov. 28, 2017):
Methodology notes for the previous version of the Nov. 1, 2016 article “Clinton Support as high as 85% among students” stated that the survey was an “opt-in” one and reported a “credibility interval.” Because every student in our target population is contacted to take the survey, these terms are incorrect and the methodology notes have been updated accordingly.