
On March 28, the College admitted 1,685 students to the Class of 2028, according to past reporting by The Dartmouth. Students admitted during regular decision joined 606 early decision admits and 74 students accepted through QuestBridge. In light of the 2028 admissions cycle coming to a close, The Dartmouth surveyed current undergraduates on their views of the College’s admissions practices.
The Application Process
Surveyed students were first asked whether they understand the College’s methods to evaluate applications. Three-fourths indicated that they understand the College’s admissions process, while one-fourth indicated confusion. More specifically, 14% claimed they had a strong understanding, while 61% reported that they understood the process only “somewhat.” Of the 25% of confused respondents, 20% were “somewhat” confused about Dartmouth’s evaluation methods, and 5% were “strongly” confused.
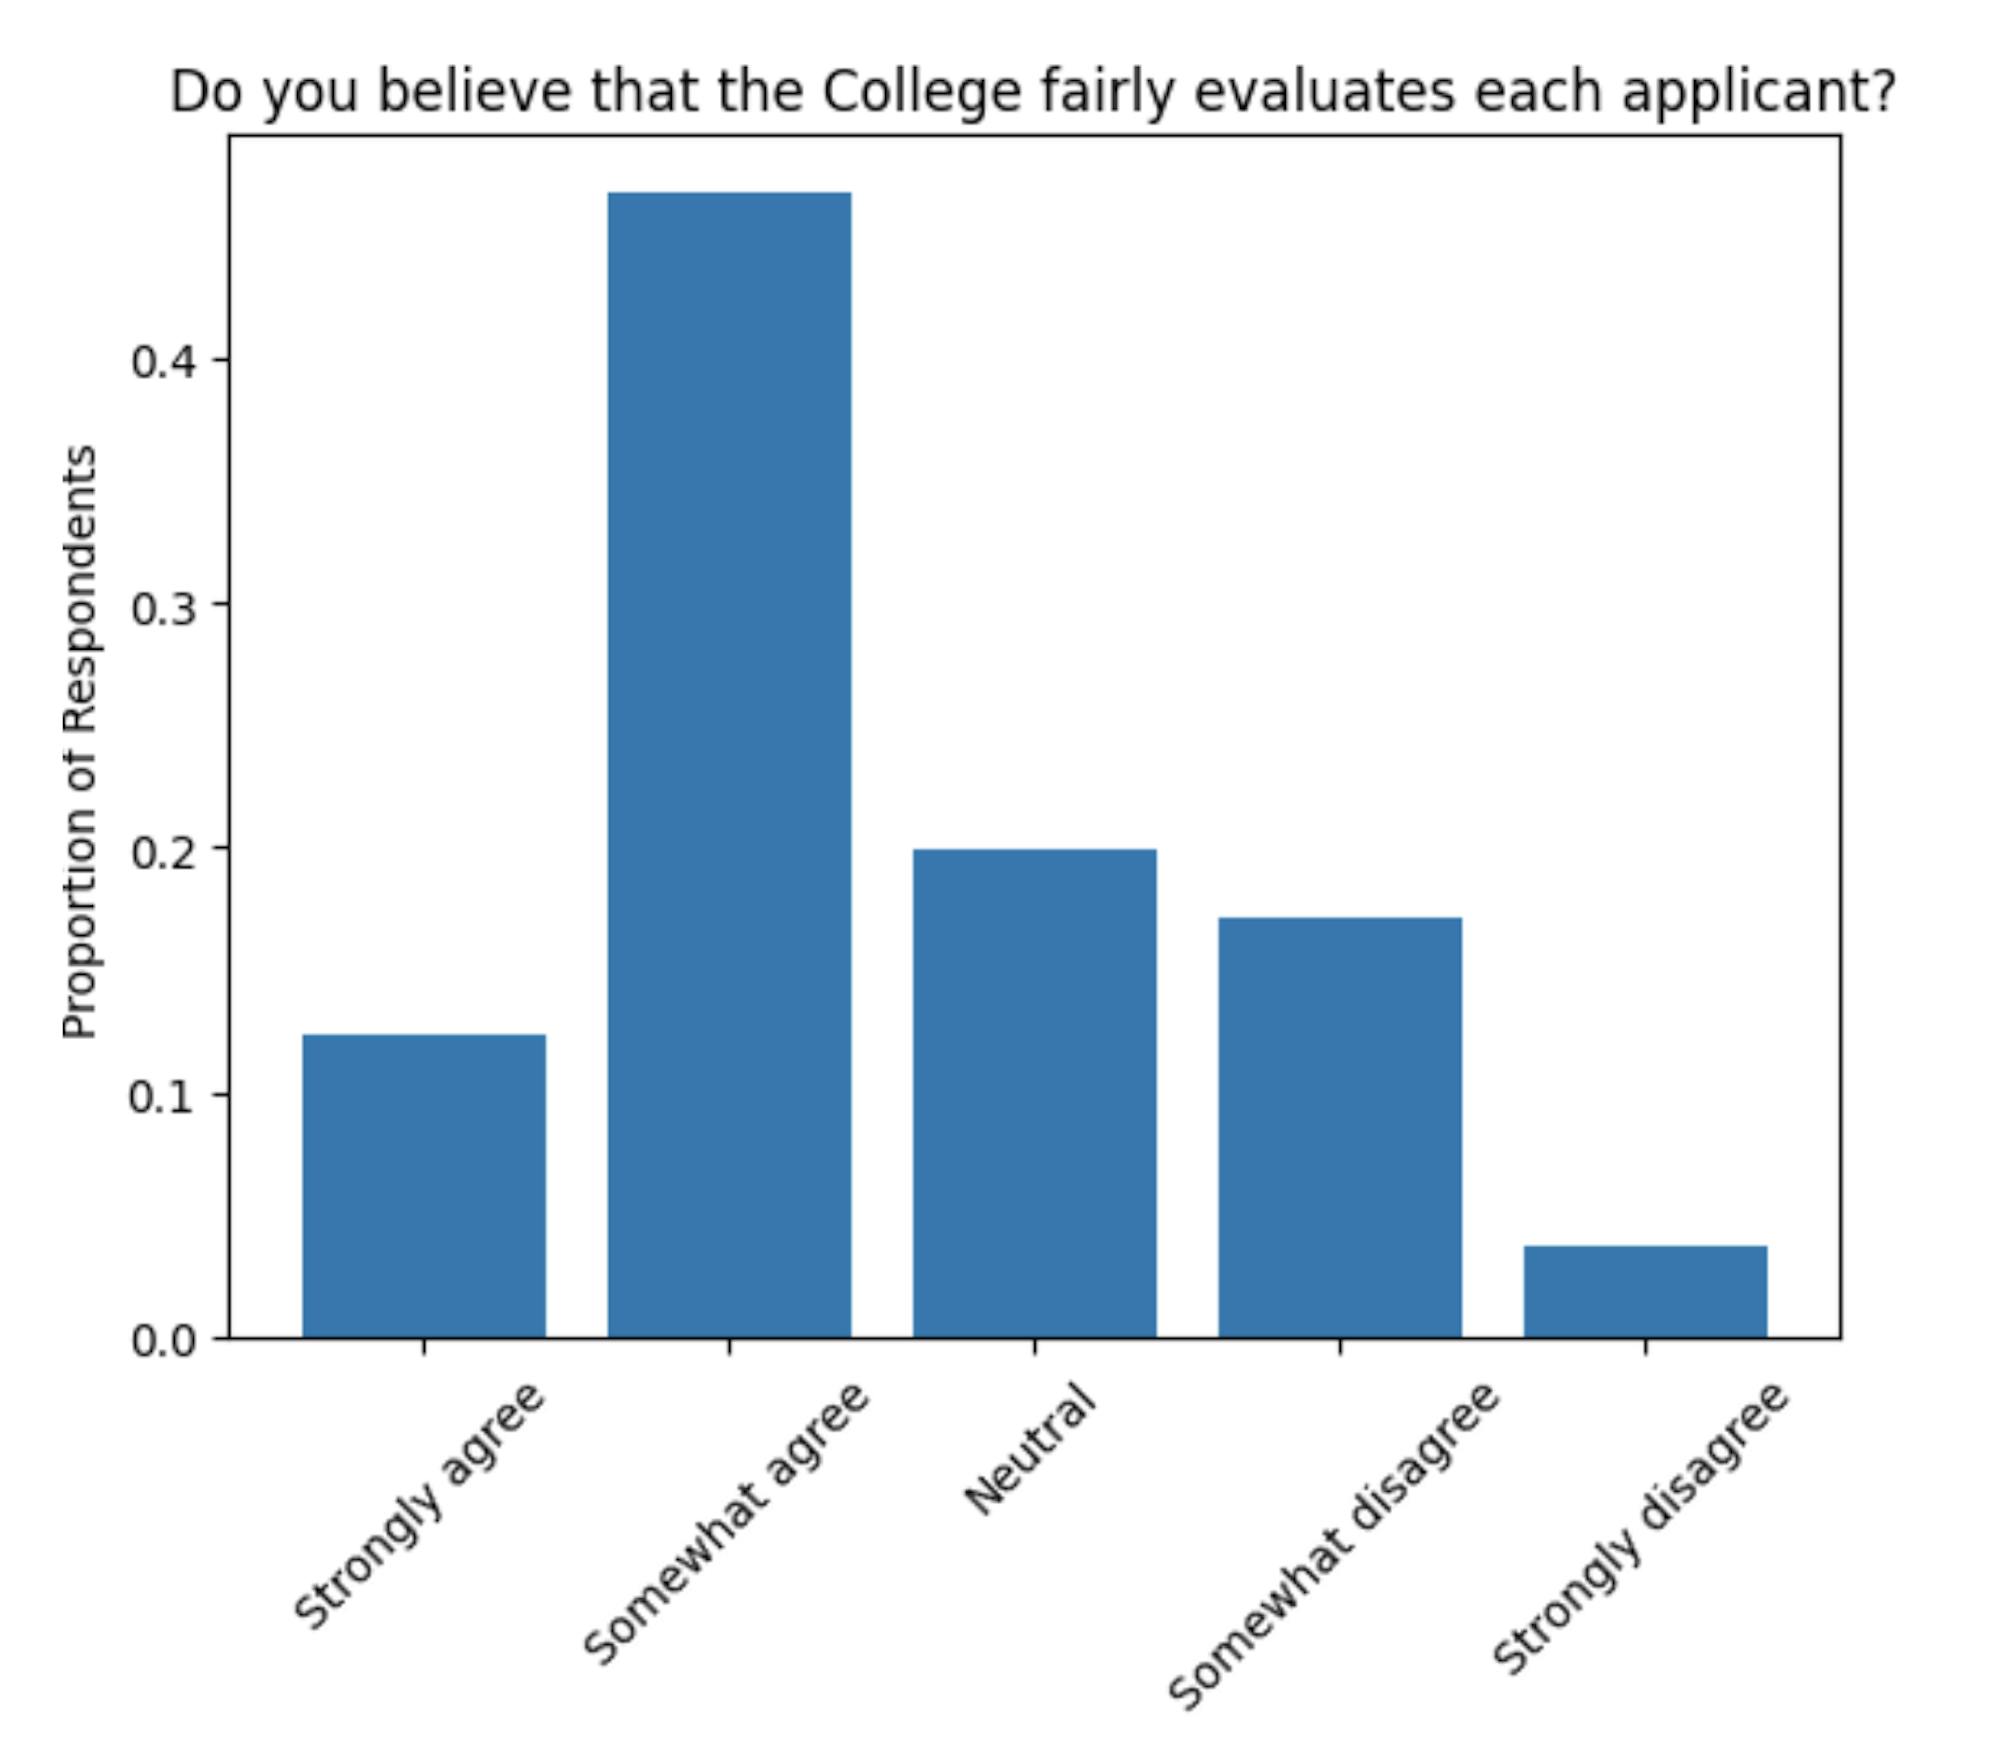
Undergraduates were then surveyed about the fairness of Dartmouth’s admissions process. The majority of respondents, 59%, agreed that the College uses fair practices, while a notable 21% disagreed. The remaining 20% held a neutral position.
When asked about the College’s admissions trajectory, 52% responded that Dartmouth admissions is moving in a positive direction, while 20% indicated the opposite. Twenty-nine percent of all surveyed students reported that undergraduate admissions is neither moving in a positive direction nor negative direction.
Dartmouth students were fairly divided on the strength of College classes. A majority, 58%, reported that Dartmouth’s classes are stronger than peer institutions, while 42% indicated that the College’s classes are either on par or weaker than peer institutions.
While Dartmouth’s admissions rates are steadily declining amid growing applicant pools, almost half of all surveyed students, 49%, do not believe lower acceptance rates correlate to an improving student body. Only 31% believe Dartmouth’s admitted classes are improving over time, while 23% did not express an opinion in either direction.
Diversity on Campus

When asked about the admissions process’s role in promoting a diverse community on campus, 75% of surveyed undergraduates said that the process fosters a diverse community, 20% thought it fosters a uniform community and roughly 5% claimed admissions do not foster diversity at all. Moreover, 79% of respondents indicated that Dartmouth should consider diversity in admissions, despite the Supreme Court’s decision to strike down affirmative action in June 2023. Twenty-one percent disagree, saying diversity should have no bearing on the decision process.
Legacy Admissions

While the majority of students support emphasizing diversity in the admissions process, most do not support giving special consideration to legacy applicants. Forty-two percent of respondents believe Dartmouth should continue legacy admissions, while 58% do not. Despite general opposition to legacy admissions, 59% of respondents indicated that legacy admissions benefit the College. Thirty percent believe legacy practices have a negative impact on the College, while roughly 11% claim preferential treatment to legacies has no impact on the College. More specifically, 18% indicated “significant” benefits, while 41% reported only “somewhat” positive impacts on Dartmouth.
Through the years: Admission rates, competition and popularity

Using common data sets from the Dartmouth Office of Institutional Research, The Dartmouth analyzed admissions rates and demographics from 2006 — when the Class of 2010 matriculated — to 2024, the most recent cycle.
Over the past two decades, Dartmouth admissions have become increasingly competitive. Acceptance rates for first-year students have decreased by 57% over the period measured — from 16% for the Class of 2010 to the record-low of 5.3% for the Class of 2028. Early decision rates — historically one of the highest in the Ivy League — have also substantially decreased, from 30% in 2006 to 20% in 2024. Getting into the College during the regular decision cycle is even harder: the Class of 2010 had a regular decision admissions rate of 13%, which has decreased nearly every year and culminated at 4% for the Class of 2028. The data does not include if some of these regular decision applicants were deferred from the early decision pool.
Average standardized test scores have also increased. From 2006 to 2020, when Dartmouth instated a test optional policy in response to the COVID-19 pandemic — the twenty-fifth percentile of ACT and SAT scores from admitted students changed dramatically. Although both the seventy-fifth percentile of admitted students ACT and SAT scores saw minimal change, the first quantile of ACT scores saw a more than 14% increase (28 to 32), while SAT scores saw a 6% increase in the reading section (670 to 710) and 7% increase in the math section (680 to 730).
Dartmouth has also witnessed a sharp increase in admissions. The total number of applicants increased by nearly 127% since 2006 — the Class of 2010 saw 13,946 applicants, while the Class of 2028 saw 31,657 applicants. The number of early decision applicants have seen an even steeper increase: 170% from 2006 to 2024 (1,316 applicants to 3,550 applicants).

In recent years, the number of first-year women who applied to Dartmouth has remained higher than the number of first-year male applicants. From 2006 to 2023, the average acceptance rate for men was 5.5%, while the average acceptance rate for women was 5.1%. When analyzing 2015 to 2023 — years in which applications from women were consistently greater than applications from men — the acceptance rate for men averaged 4.6% and the acceptance rate for women averaged 4.1%.
Dartmouth has also seen an increasing yield, or the percent of students who accept an offer of admission. The College’s yield has increased by more than 40% (49% to 67%) since 2006. The average yield in the 17 years measured is 55%. Although the total number of students enrolled has increased by around 11% from 2006 to 2023 (1,081 to 1,206), the number of admitted students has decreased by 23% from 2006 to 2024 (2,184 to 1,685).
Type of students attending Dartmouth through the years

The number of enrolled white students has decreased by nearly 16% in the last 17 years, while the number of Hispanic and nonresident students has increased by 77% and 177%, respectively. The number of Asian enrolled students fluctuated between the Classes of 2010 and 2026, with a slight increase of 14% (155 to 177) in the number of Asian students attending. By race, the number of white students enrolled remains substantially higher than Asian, Black, Hispanic, multiracial, Native American and nonresident students.
The stagnation in Black and Native American enrolled students may stem from the introduction of “multiracial” as an identifier for race in 2010. Moreover, unknown or unidentified races are not included in this sample, which may skew results.
By gender, the enrollment rate has stayed relatively even between male and female students. Meanwhile, the percentage of students in the top 10th of their high school class who choose to attend has increased from 90% in 2006 to 94% in 2023.
Methodology Notes:
From March 27 to April 9, The Dartmouth fielded an online survey of Dartmouth students on their opinions about the College’s admissions process. The survey was sent to 4,447 undergraduate students through their school email addresses. Two hundred and seventy-five responses were recorded, resulting in a 6.2% response rate. All data reflected in the article’s text is approximate. Using administrative data from the College’s Office of Institutional Research, responses were weighted by class year, gender and race/ethnicity. Weighting was done through iterative post-stratification (raking). Survey results have a margin of error ± 5.1 percentage points.


