

This article is featured in the 2025 Commencement & Reunions special issue.
For the tenth consecutive year, The Dartmouth surveyed the opinions and experiences of Dartmouth’s graduating class. Since arriving at Dartmouth in 2021, the Class of 2025 has experienced notable change — bearing witness to two College presidencies, a national election and disruptions due to the pandemic. The Dartmouth aims to capture our unique graduating class’s final thoughts in this article. The Dartmouth’s survey canvassed the following four topics: campus issues, student life, national and local politics and post-graduation plans.
Campus Issues
According to The Dartmouth’s survey, 90% of students in the Class of 2025 report being satisfied with their Dartmouth education, with 57% of students extremely satisfied and the other 33% somewhat satisfied. Three percent of respondents were neither satisfied nor dissatisfied six percent were somewhat dissatisfied and the remaining one percent were extremely dissatisfied with their Dartmouth education.
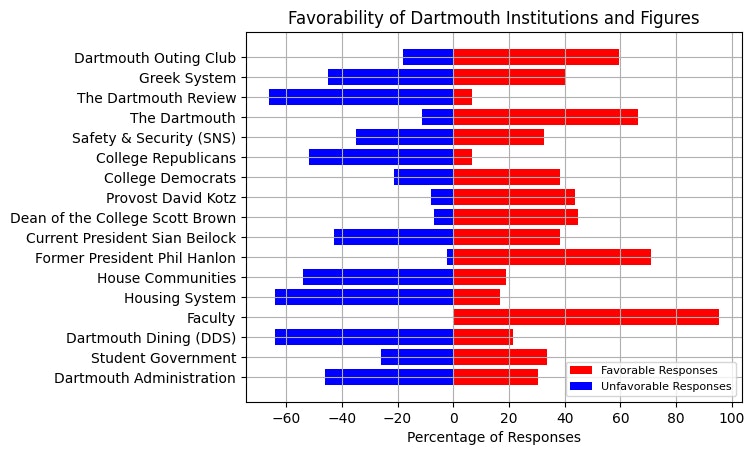
In addition to their education at large, The Dartmouth also polled students on their views on specific campus issues, organizations, people and services — pictured in the above graph. The Dartmouth Review — Dartmouth’s conservative newspaper — received the most unfavorable ratings (66.29%), followed closely by the housing system, established in 2016, and Dartmouth Dining Services — with 64.04% opposed to each. The next most unfavorable were housing communities, 53.93% opposed, and College Republicans, 51.69% opposed.
Faculty, meanwhile, received favorable responses from 95.51% of respondents, placing them above former president Phil Hanlon, 70.79% in favor. These were followed by The Dartmouth with 66.29% in favor, the Dartmouth Outing Club with 59.55% in favor and former Dean of the College Scott Brown with 44.94% in favor.
Seniors were then asked how often they used College resources. Departmental advisors were used “often” by 12.5% of respondents, more than any other resource. The Student Wellness Center was next most commonly used, with 11.36% of students indicating that they refer to their advisors “often.” The vast majority of seniors, 80.68%, indicated that they know about the Academic Skills Center but did not find it useful. Similarly, 68.18% of respondents knew about the writing center but did not find it useful. On the other hand, 13.64% and 9.09% of respondents were unaware of departmental advisors and Information, Technology and Consulting services, respectively.
The Dartmouth also surveyed the Class of 2025 about resources on campus for sexual violence prevention and mental health. For sexual violence prevention, 24.14% reported being extremely satisfied with resource allocation, and 44.83% were somewhat satisfied. Another 16.09% were neutral, while 12.64% and 2.3% were somewhat dissatisfied and extremely dissatisfied, respectively. With respect to mental health resource allocation, 5.75% were extremely satisfied, 40.23% were somewhat satisfied, 16.09% were neither satisfied nor dissatisfied and 28.74% and 9.2% were somewhat or extremely dissatisfied, respectively.
The next topic was the College’s response to the COVID-19 pandemic. With some of Dartmouth’s pandemic policies still in place in their freshman year, 18.39% of seniors were “extremely dissatisfied.” Another 31.03% were somewhat dissatisfied, 27.59% were neither satisfied nor dissatisfied, 17.24% were somewhat satisfied and 5.75% were extremely satisfied.
The Dartmouth also asked about future financial contributions — 20.45% of the Class of 2025 responded that it is extremely unlikely that they will donate to Dartmouth in the future, and 14.77% believe it is somewhat unlikely. Furthermore, 12.5% indicated that they are neither likely nor unlikely to donate, while 27.27% and 25% indicated it is somewhat likely or extremely likely, respectively.
Student Life
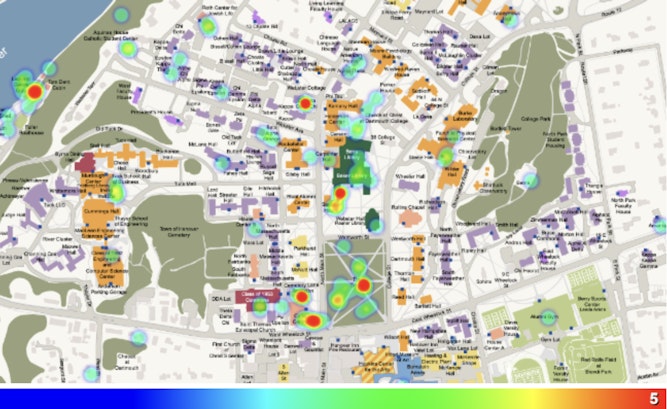
A heat map showing the Class of 2025’s favorite places on campus — the Green, Baker-Berry Library, Sanborn Library, Collis and the Ledyard Canoe Club were among the seniors’ top spots.
The Dartmouth’s survey then pivoted to life on campus. The first question provided seniors with three behaviors — alcohol consumption, drugs and substance use and sexual activity — and asked students whether they participated in them for the first time while at Dartmouth, had done them before coming to Dartmouth or have yet to engage in them. Of the Class of 2025, 32.18% consumed alcohol for the first time at Dartmouth, 60.92% had consumed alcohol previously and 6.9% have not consumed any alcohol. Additionally, 37.93% reported using drugs for the first time in college, 24.14% had already used drugs and 36.78% have not used any. Meanwhile, 47.13% of seniors reported their first time being sexually active was at Dartmouth, 35.63% said they had been sexually active prior to starting college and 13.79% had not engaged in sexual activity.
The Class of 2025 was then asked about how often they used substances such as marjuana and nicotine. Marijuana, nicotine and non-prescribed “study drugs” like Adderall, had the highest response rates of being used “often” with 22.64%, 16.98% and 5.66% of surveyed students respectively. The substances with the highest percentages of “never” used responses were ketamine, non-prescription study drugs like Adderall and cocaine with 77.36%, 77.36% and 69.82%, respectively. In other words, study drugs were both highly popular and highly unpopular.
Next, the Class of 2025 was asked about one of the most storied Dartmouth traditions: the Dartmouth Seven — a list of seven locations where students are challenged to engage in sexual activity. Of the surveyed students, 34.88% reported that they completed at least one of the Seven. Of students that completed the Seven, BEMA was the most popular location, with 82.14% of responses. The Baker-Berry Stacks came in second with 78.57% of participating students, while the President’s lawn and the Green trailed in a tie for third with 28.57% each. The steps of Dartmouth Hall yielded the next most responses (25%), followed by a tie between the 50-yard line of the football field and the Top of the Hopkins Center, with 21.43% each.
The Dartmouth also asked graduating students how many people they had dated at Dartmouth. The plurality, 31.27%, reported dating one person, followed by 26.74% never dating anyone and 25.58% dating two people. A small portion, 10.47%, dated at least three people.
Seniors were then asked about the most important aspects of their life at Dartmouth, to which the most common answers were social life and academics and research with 84.27% each as well as extracurricular activities, 69.66%. When asked about what they did not consider important, 79.78% reported political groups, 74.16% reported varsity sports, 70.79% reported housing communities and 56.18% reported club and intramural sports.
To gauge how the Class of 2025 chose their majors, The Dartmouth asked participants how heavily they considered the following topics: academic interest, post-graduation career, parental and familial pressure and class rigor. The factors ranked by percentage of “extremely important” responses are: academic interest at 67.42%, post-graduation career at 26.97%, rigor of classes at 8.99% and parental and familial pressure at 1.12%.
The Class of 2025 was then asked about their views on a variety of Dartmouth traditions. Events ranked by the percentage of “most important” responses are: Sophomore Summer by 38.2% of respondents, Green Key by 29.21%, First-Year Trips by 25.84%, Homecoming by 7.87% and Winter Carnival by 2.25%.
One of the most unique parts of Dartmouth is the D-Plan, which allows students more flexibility for when they take their off-terms. As such, students were surveyed about what they did during their off-terms. The most popular responses were paid internships — with 65.56% of respondents — and travel, with 56.67% of respondents. Another 40% of respondents indicated that they conducted paid research during their off term at least once.
The seniors also experienced the end of the COVID-19 pandemic during their time at Dartmouth — with pandemic-era politics still in place during their first year on campus. Only 28.89% never contracted COVID-19, while 44.44% contracted it once, 17.78% twice and 8.89% three or more times.
The Dartmouth also asked graduating seniors how long they spent consuming social media content per day. Roughly 4.55% reported spending more than three hours on social media per day, 23.86% reported 90 minutes to three hours, 52.27% reported 30 to 90 minutes, 15.91% reported less than 30 minutes and 3.41% students reported spending no time on social media.
The Dartmouth also gauged how long students spent on school work outside of class time every day. Of respondents, 39.33% spent two to four hours studying, 38.20% spent four to six hours studying and 7.87% spent six to eight hours. Another 8.99% students spent less than two hours studying per day, while 5.62% spent more than eight hours studying.
Lastly, The Dartmouth asked seniors how many hours of sleep they typically get each night. 18.89% slept eight to 10 hours, 71.11% six to eight hours, 8.89% four to six hours and 1.11% more than ten hours. Thankfully, no senior reported sleeping, on average, less than four hours each night.
Politics
The survey asked a series of questions to gauge the political views of the Class of 2025. The Dartmouth first asked about the future of the country: 78.65% percent believe the country is generally headed in the wrong direction, 14.61% are not sure and 6.74% believe the country is generally headed in the right direction.
Next, the survey asked about views on a variety of political figures and institutions. For unfavorable views, president Donald Trump had the highest unfavorability among respondents at 87.64%. Trump was followed by the Republican Party at 83.15%, Congress at 60.67%, the Supreme Court at 56.18%, and Wall Street at 52.81%. These views are similar to the sentiments of the Class of 2024, where 87.18% had unfavorable views of Trump, 75.06% for the Republican Party, 62.01% for the Supreme Court and 56.41% for Wall Street.
For favorable views, former Vice President and Democratic presidential candidate Kamala Harrris had the highest percentage of respondents at 58.43% by a large margin, followed by 46.07% for former President Joe Biden, 42.7% for the town of Hanover, 34.83% for the Democratic Party, 17.98% for the New Hampshire state government, 15.73% for the Supreme Court and 13.48% for Wall Street. This year’s seniors generally have more favorable yet different sentiments when compared with the Class of 2024, where 34.33% held positive views for Biden, 26.52% for the Democratic Party, 25.35% for the Town of Hanover, 23.19% for Harris, 20.14% for Supreme Court, and the New Hampshire State Government not being in the top seven most favorable.
The survey also asked about general political opinion among graduating seniors: 47.67% reported being liberal, 22.09% very liberal, 18.6% moderate, 10.47% conservative and 1.17% very conservative.
To gauge how political views may have shifted during the Class of 2025’s time at Dartmouth, the survey also asked them what their political views were before coming to the College. Of respondents, 44.83% were liberal, 25.29% very liberal, 19.54% moderate, 8.05% conservative and 2.3% very conservative. Overall, the composition of students’ political ideologies in the Class of 2025 stayed relatively constant.
The Dartmouth also asked graduating seniors with which political party they are registered to vote. The Democratic Party received a slight majority, with 52.33% of respondents. Independents followed with 23.26%, the Republican Party and unregistered or unable to register each with 11.63% and the Libertarian Party with 1.16%.
The survey also asked graduating students how many of their closest friends share similar political beliefs. Of respondents, 71.26% said most do, while 14.94% said some do. Another 5.75% of respondents reported that a few do, while 4.6% indicated that all of their friends do. Finally, 2.3% of seniors were not sure how many of their friends share similar beliefs and 1.15% reported that none of their friends have similar beliefs as them.
The survey then asked students how comfortable they were sharing their political beliefs on campus. In response, 33.33% reported being somewhat comfortable, 28.74% somewhat uncomfortable, 24.14% extremely comfortable, 10.34% neither comfortable nor uncomfortable and 3.45% extremely uncomfortable.
Finally, The Dartmouth asked the seniors how familiar they were with current domestic and world news while at Dartmouth. The plurality, 35.23%, believed they were very familiar, while 30.68% believed they were moderately familiar, 20.45% extremely familiar and 13.64% slightly familiar with current events while at Dartmouth.
Post-Graduation Plans
The final section of the survey investigated post-graduation plans. The overwhelming majority of respondents, 60%, indicated that they will join the workforce. Several students reported plans to attend graduate school: 17.78% indicated that they were joining a non-medical, non-law or non-business graduate program, while 8.89% indicated that they were attending a medical, law or business school. Among the remainder, 3.33% of students will travel, 2.22% will serve in the military and 7.78% are unsure of their plans.
For those who are joining the workforce, consulting, technology and engineering and finance had the highest percentage of responses, with 26.92%, 21.15% and 17.31% respectively. Ten years after graduation, these numbers are expected to drop to 4.71%, 9.41%, and 9.41%, while 14.12% expect to have a career in healthcare and 12.94% in academia and research. Not only are people considering changing careers after graduation, but 67.86% also indicated their desired occupation changed during their time at Dartmouth.
With respect to compensation, 36.73% anticipate a starting salary of $75,000 to $100,000, while 30.61% expect a starting salary of $100,000 to $200,000. Another 20.41% predict a salary of less than $50,000, while 10.21% believe they will enter the workforce with a salary of $50,000 to $75,000. Finally, 2.04% believe they will have a starting salary of at least $200,000.
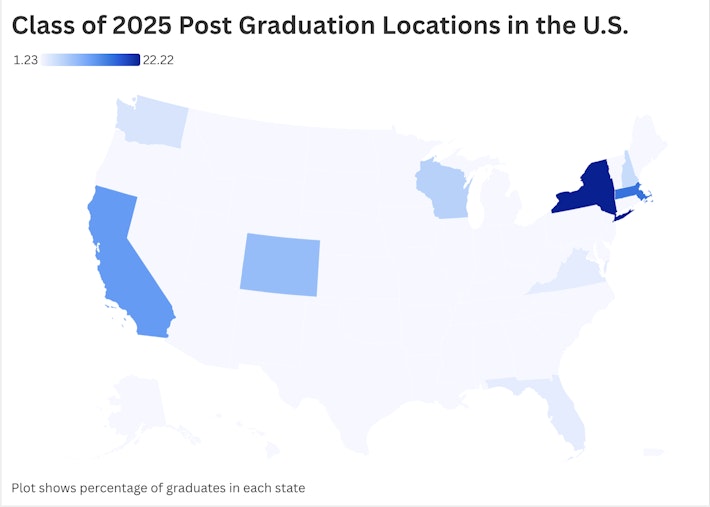
A significant majority of Dartmouth seniors, 92.05%, indicated that they plan to stay in the United States after graduation. Another 3.41% believe they will live in Europe after their undergraduate years. For those staying in the U.S., New York, Massachusetts, California and Colorado were the most likely destinations, garnering 21.52%, 16.46%, 11.39% and 8.86% of respondents, respectively. The majority, 82.56%, do not plan on staying in the Upper Valley.
Despite Dartmouth’s tuition increasing by more than 12% since the Class of 2025 entered the College, the majority of students, 82.35%, do not anticipate graduating with any student loan debt, while 7.06% plan on having less than $10,000 in debt, and 3.53% foresee $20,000 to $49,999 in loans. The remaining 7.06% of respondents expect more than $50,000 in student loan debt. Whether or not a student graduates with debt is likely influenced by Dartmouth’s financial aid program. For the 2024-2025 academic year, no parent contributions were expected from any family with an income of less than $125,000 a year, after the College received a $150 million donation from Barbara and Glenn Britt ’71 Tu ’72. Many students are now able to attend Dartmouth without having to worry about taking out loans or graduating with debt.
Finally, roughly half of graduating students indicated that they will not receive financial assistance from their parents for rent or other living expenses after graduation.
Methodology Notes:
From May 19 to June 8, The Dartmouth executed an online survey of Dartmouth senior students on their opinions and experiences at the school. Through college email addresses associated with the Class of 2025, the survey was sent to 1,222 undergraduate student recipients, of which 101 responded, yielding a response rate of 8.3%. Using administrative data from the College’s Office of Institutional Research, responses were weighted by gender and race/ethnicity. Weighting was done through iterative post-stratification (raking). The answer choices were inverted for multiple questions in the survey, which may have led to incorrect answer selections. Survey results have a margin of error +/-6.1 percentage points with 80% confidence.


