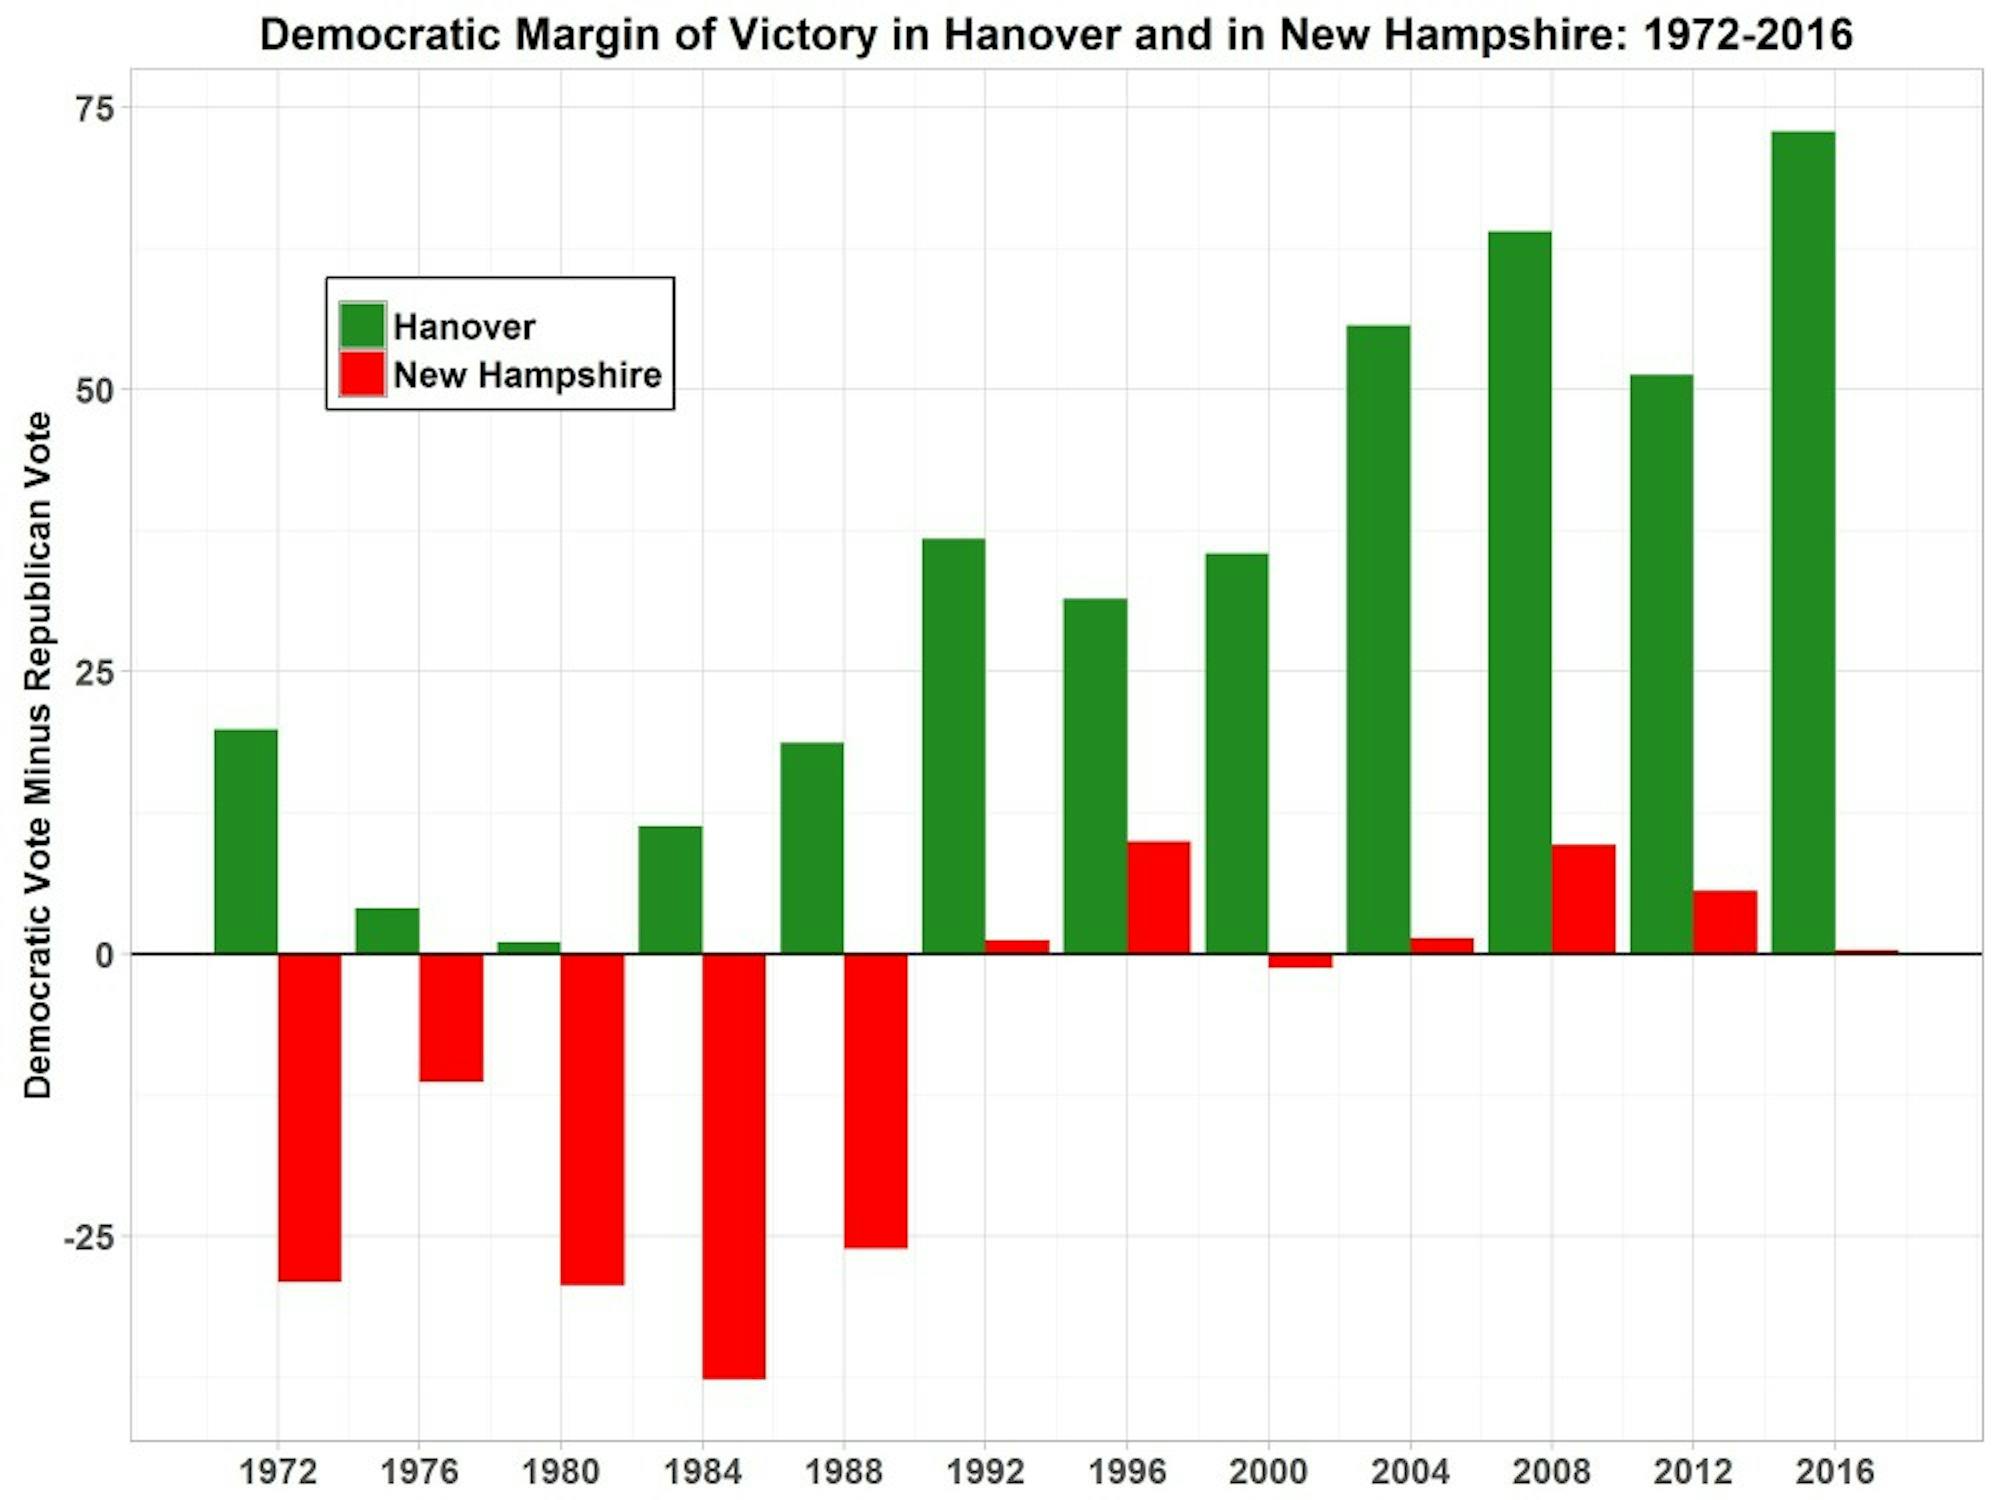
In the 2016 presidential election, the margin of victory for Hillary Clinton in the town of Hanover was 72.9 percentage points (84.9 percent voted for Clinton, 12 percent for Donald Trump). The two-party Democratic vote margin in Hanover represents the largest victory for a Democratic candidate in at the very least the last 12 elections dating back to 1972. The next closest victory as large came in 2008, when Hanover residents voted for Barack Obama 64 percentage points more than they did for John McCain.
This historic vote margin favor of the Democratic candidate also represents the largest difference between the Democratic margin of victory in Hanover and the same margin for New Hampshire statewide. Clinton only won the Granite State by 0.3 percentage points. That makes for a 72.6 percentage point difference between how Hanover voted and how New Hampshire voted. The next widest margins in 2008 and 2004 were not nearly as emphatic as in 2016, with percentage point differences—between town and state—of 54.4 and 54.3 points, respectively.
Estimates of voter turnout in Hanover, NH point to the 2016 election as having the second highest voter participation in the town over the last five elections. Among citizens 18 years old or older, an estimated 88 percent of Hanover residents voted in this past Tuesday’s presidential election. That represented an increase over the prior election in which there was an 83.2 turnout rate. The high point for turnout during this five-election span occurred in 2008, when 88.8 percent of Hanover residents participated in the presidential election.
Total votes cast for presidential candidates, the numerator in the turnout calculation, came from New Hampshire Public Radio Election Stats data. Citizen voting age population (CVAP), the denominator in turnout, came from U.S. Census data for the minor civil division for Hanover. CVAP was not available at each specific year in which an election took place. Instead, the CVAP totals were taken from five year estimates. These five year estimates were chosen to contain the election year, and thus best correspond to it.