From July 5 to July 9, The Dartmouth administered an online survey of student attitudes on issues related to the Dartmouth community. Focusing only on the opinions of students on campus, the survey was only sent to members of the Class of 2018. Other students on campus were excluded. Two hundred thirty of the 1,152 students in the Class of 2018 responded, making for a 20.0 percent response rate. With that caveat in mind, what follows are the results of the survey.
Afew survey questions asked about the Black Lives Matter movement. It is possible that recent events related to Black Lives Matter may have influenced responses. For the most part, the survey was taken before news arose of the shooting of two black men, and later the shooting of five Dallas police officers. The impact of these events on survey responses is thus likely limited.
Demographics
The gender breakdown of respondents was roughly equal — 46.5 percent of respondents were male, and 52.7 percent were female. When asked about their race/ethnicity, 62.2 percent of respondents identified as white, with the remaining 37.8 choosing Black, Asian, Hispanic, multi-racial or other races. This marks an unrepresentative quality of the sample to keep in mind, as the class of 2018 is 12 percentage points less white — according to administrative data — than what the survey showed. 44.6 percent of respondents said they came from families with household incomes greater than $200,000, while 8.9 percent said their family income was less than $50,000.
Of students surveyed, 77.3 percent said they were part of a fraternity, sorority or gender-inclusive fraternity. While the survey did not ask about American politics, it recorded party identification. 69.6 percent of respondents identified as Democrats/leaning Democrat, while 21.4 percent identified as Republicans/leaning Republican.
Favorability Ratings
For several major events, changes and other entities at Dartmouth, the survey asked whether students had a very/somewhat favorable or very/somewhat unfavorable opinion on these matters. To form a composite measure, we subtracted the percent of students with an unfavorable view on an issue from the percent of those with a favorable view on it, yielding a net favorability rating.
The first topic the survey asked about was the approval rating for how College President Phil Hanlon has handled his job as president of Dartmouth. While 13.2 percent of respondents approved of his work as president, 71.2 percent disapproved, making for a -58 approval rating.
Of the 11 issues surveyed, only two were viewed favorably by Dartmouth students: faculty at the school, with a +84.3 net rating and the Divest Dartmouth movement, with a 29.6 favorability rating. The remaining questions touched on several controversial aspects of Dartmouth life as of late, and accordingly did not receive as positive a reception.
In September 2015, the College ended need-blind admission for international students. Several months later, surveyed sophomores had a -78.2 net favorability of the decision, the least favorable of all issues polled. The next least favorable issue was the College administration as a whole, which received a -75.5 net rating, followed by the “Moving Dartmouth Forward” policy initiative with a rating of -65.7.
Students had a similarly unfavorable view of recent de-recognitions and suspensions of Greek houses for various violations (-40.7) and the new housing system (-39.8). The on-campus Dartmouth Dining Services received a -10.6 favorability rating. Regarding journalistic publications on campus, students did not have especially favorable opinions. Of the three regular outlets, The Tab had the worst favorability rating at -43.1, with The Dartmouth Review at -35.2 and The Dartmouth at -1.9.
For some of these topics, favorability ratings were split along Greek affiliation lines. Those affiliated viewed DDS about 22 net percentage points less favorably, the new housing system 39 points less favorably, the recent de-recognitions/suspensions 76 points less favorably, Moving Dartmouth Forward 31 points less favorably and the administration 38 points less favorably than unaffiliated students did.
Black Lives Matter
Mirroring the growth of the movement on a national level, Black Lives Matter has also taken an increasingly significant role on the Dartmouth campus.
When asking about the Black Lives Matter movement as a whole, the survey questions differentiated between the movement at the national level and the one on the Dartmouth campus. Seventy-three percent of students said they support the national movement. That level of backing drops considerably at the more local level, however, as only 39.3 percent of survey respondents said they supported the Black Lives Matter movement on campus. Of the remainder, 16.4 percent they supported neither the national nor campus movements, and 10 percent said they were not sure.
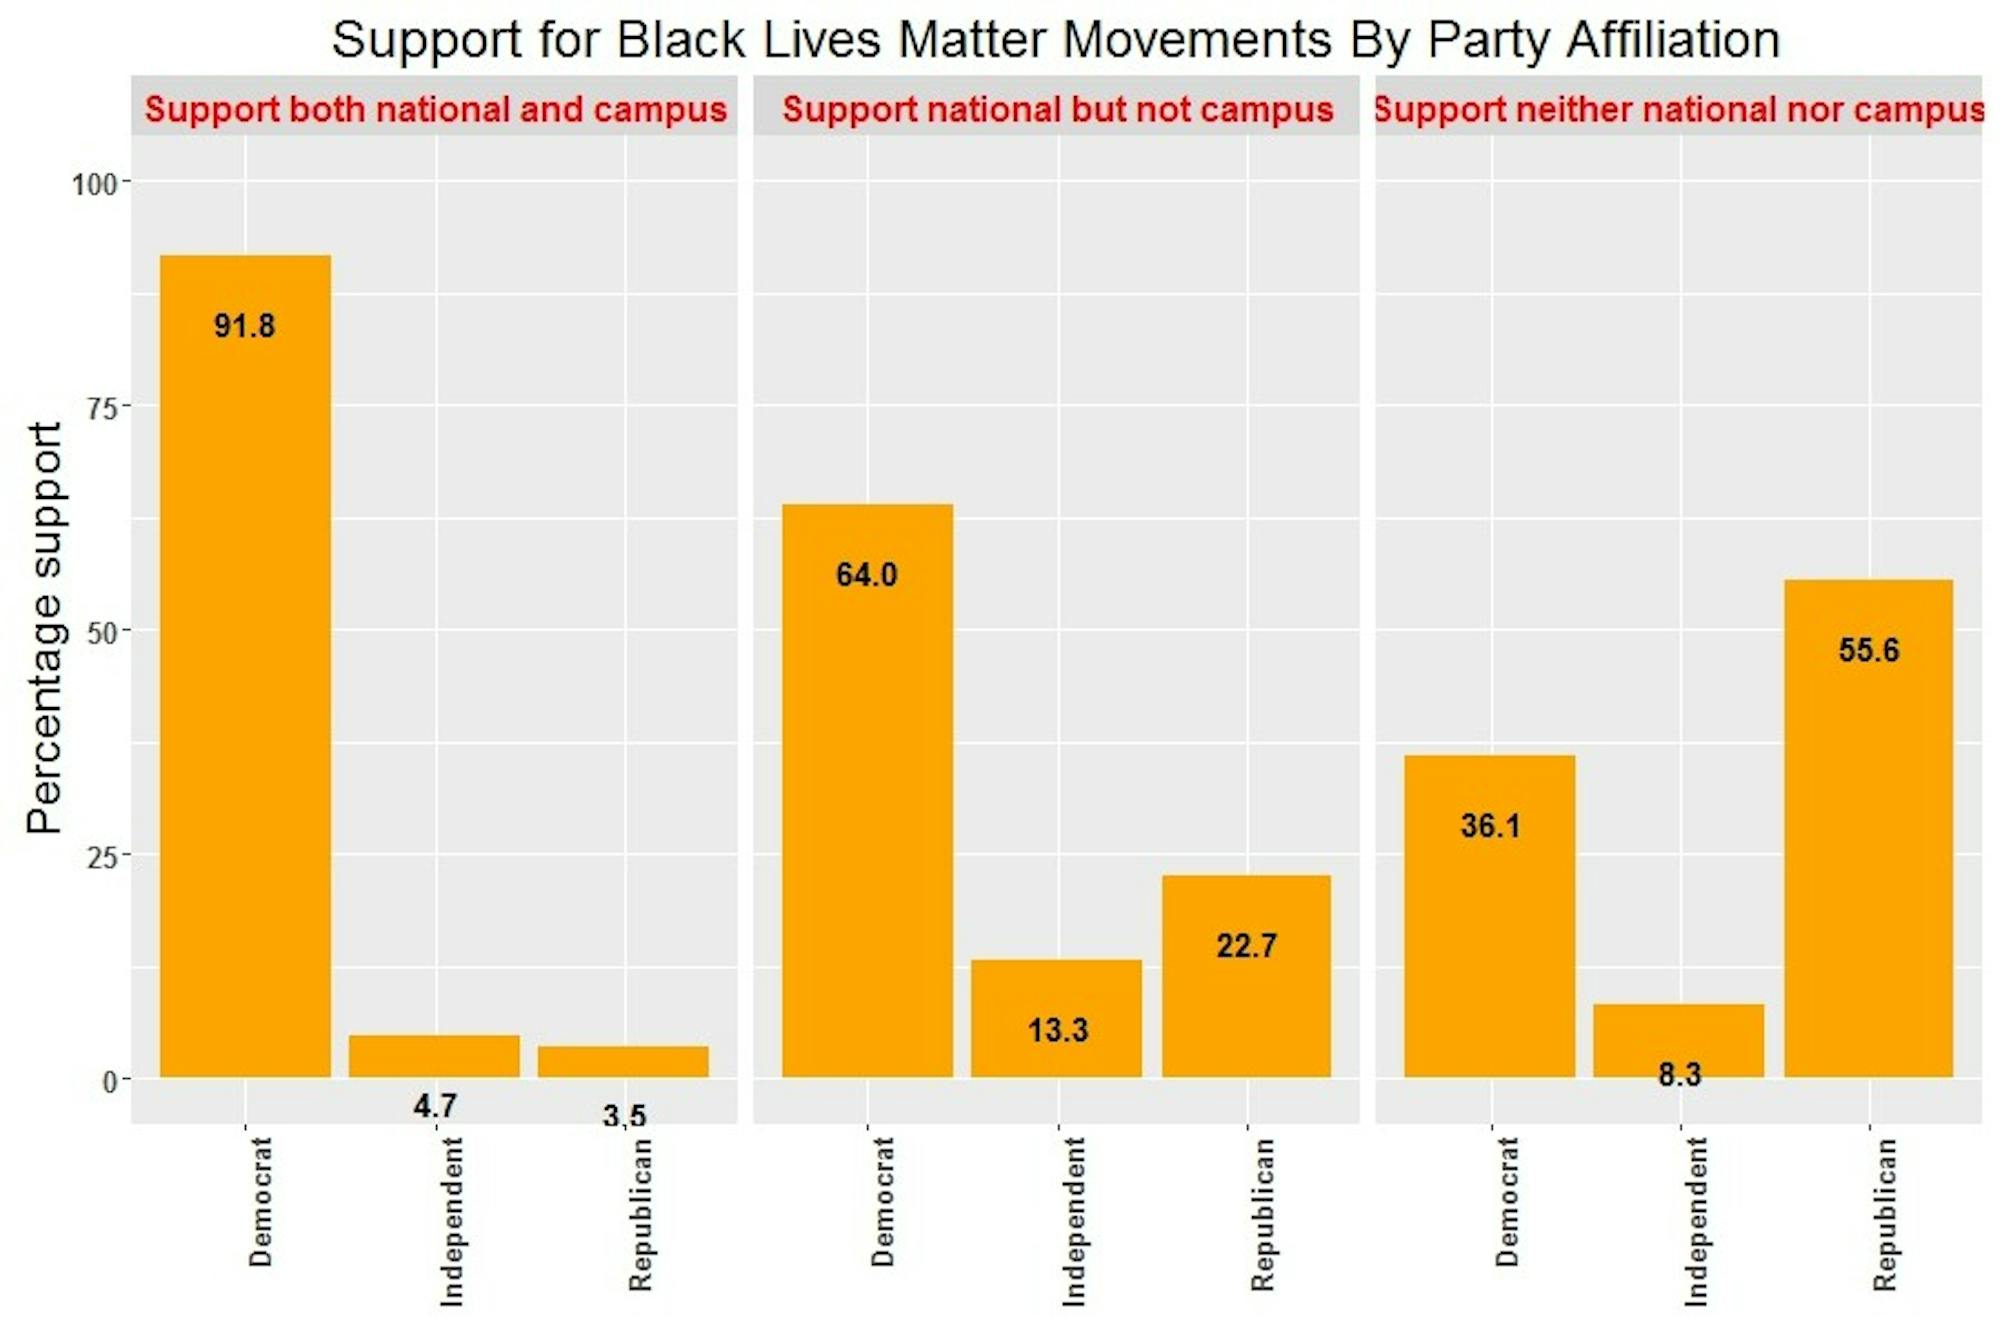
This opinion on the movement broke down along a few different social characteristics. While 51.7 percent of self-identifying Democrats supported both the national and campus movements, only 6.4 percent of Republicans did. Meanwhile, 8.6 percent of Democrats opposed both, as opposed to 42.6 percent of Republicans. Similar percentages of Democrats (31.8) and Republicans (36.2) supported the national movement but opposed the campus one.
Due to the somewhat correlated nature of partisanship and gender, a similar split occurred along gender lines. Women were much more likely to support Black Lives Matter while men were more likely to oppose it. Comparing the opinions on this issue of white and non-white students showed less of a divide than by political leaning or gender, though non-white students still showed greater support for the movement.
In November 2015, a Black Lives Matter “Blackout” demonstration took place on various parts of campus. Allegations later surfaced of demonstrators using physical violence towards other students during the protest when passing through Baker-Berry Library. However, no official reports of violence have been documented. The issue of whether protestors used violence remains contested. Of the sophomore students surveyed, 37 percent believed that the protestors definitely or probably used violence, while 46.5 percent believed that protestors definitely or probably did not use violence.
Prior to this demonstration, t-shirts hung up in a Black Lives Matter display in the Collis Center representing unarmed people killed by police were removed. On the question of whether this action was intentional, 47.2 percent of respondents said it definitely/probably was, while 45.4 percent said it definitely/probably was not. This result marked one of the more divisive issues in the survey.
In May 2016, a “Blue Lives Matter” display placed by College Republicans in the Collis Center as part of National Police Week was removed and replaced with Black Lives Matter posters. When asked about the level of support for the removal and replacement, responses were more one-sided — 61.4 percent said they strongly/somewhat opposed the action, while 33.5 percent strongly/somewhat support it.
The topic of retention and the importance of faculty of color at the College also came to a head as of late. In May 2016, the denial of tenure for English professor Aimee Bahng was met with criticism from students, Dartmouth faculty and people unaffiliated with the College, reigniting debate over granting tenure to and retention of faculty of color. When asked about this decision to deny tenure, 46.2 percent of surveyed students said they opposed it, while 26.1 percent said they supported it.
On the broader issue of retention of faculty of color at Dartmouth, students were fairly emphatic in their viewpoint on the matter: 81.8 percent said the issue was very or somewhat important, while only 12.7 percent said it was not very or not at all important.
Miscellaneous
Finally, the survey inquired about a variety of other issues.
Sexual assault: Regarding Dartmouth’s recent efforts to strengthen its sexual assault policies and create stricter punishments, 43 percent of sophomore students said the changes have been adequate, 37.9 percent said the changes have not gone far enough and just 5.1 percent said these policy changes have gone too far. While 60.4 percent of male students said the changes have been adequate, only 27.7 percent of female students said the same. Likewise, 57.1 percent of women believed the changes have not gone far enough and 15.8 percent of men did.
Greek life: On the subject of the presence of Greek life on campus, students showed resistance to too much change. A plurality at 40.3 percent of students felt that the presence of Greek life should stay the same, while 26.4 percent said they wanted Greek life to increase a little and 19.9 wanted it to decrease a little. Only 5.6 percent of respondents wanted to eliminate Greek life on campus entirely.
Corporate recruiting: While more than a third of respondents did not have an opinion on the issue, students generally viewed corporate, consulting and banking recruitment programs occurring on the College’s campus favorably. Forty-seven percent of those surveyed approved of them, while 16.8 percent disapproved.
Free speech: The issue of free speech has come to the forefront on several college campuses across the country. When surveyed students were asked whether they agree with the statement that “free speech and expression of all students is valued at Dartmouth,” 37 percent agreed with the statement while 52.3 percent disagreed. Interestingly, Democrat and Republican students did not feel significantly differently about this issue. Compared to white students, non-white respondents were 15 percent points less likely to agree with this statement.
Tradition: Tradition often proves a very prominent part of Dartmouth life for students. When asked whether “at Dartmouth, we should value and closely follow traditions,” 61.6 percent of students agreed with the statement, while 29.2 disagreed. A partisan dimension formed in responses to this question, with 50.4 percent of Democrats and 95.6 percent of Republicans agreeing with the statement.
Correction appended (July 15, 2016):
The original version of this article incorrectly stated that 95.6 percent of Republicans disagreed with the statement "at Dartmouth, we should value and closely followed traditions." In fact, 95.6 percent agreed with the statement.
Correction Appended (Nov. 28, 2017):
Methodology notes for the previous version of the July 14, 2016 article “Survey reveals frustration with College administration” stated that the survey was an “opt-in” one. Because every student in our target population is contacted to take the survey, this term is incorrect and the methodology notes have been updated accordingly.